PCA vs t-SNE vs UMAP
Comparing dimensionality reduction techniques for visualizing data.
Verdict: Use PCA when you need to preserve exact global distances or run instantly; use UMAP as the modern default for visualizing high-dimensional clusters; use t-SNE only if maintaining legacy codebases.
The Short Answer
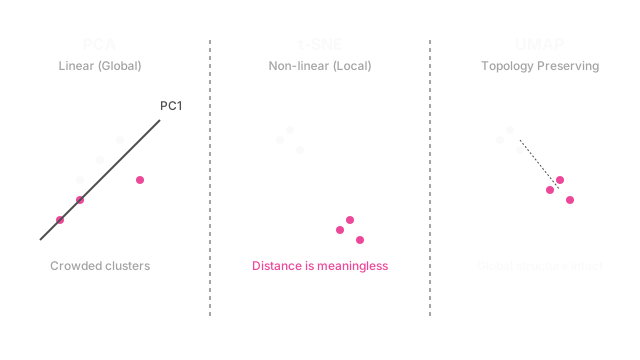
Principal Component Analysis (PCA) is a deterministic, linear algorithm that preserves the global distances between points but often crowds distinct groups together. t-SNE is a non-linear algorithm that perfectly separates local clusters but destroys the global distances between those clusters. UMAP is a faster, modern successor to t-SNE that separates local clusters while doing a significantly better job at preserving the global distances between them.
Where They Differ
| Feature | PCA | t-SNE | UMAP |
|---|---|---|---|
| Mapping Type | Linear projection | Non-linear manifold learning | Non-linear manifold learning |
| Global Structure (Distances between clusters) | Preserved perfectly | Destroyed (a cluster 1 inch away might be just as different as one 10 inches away) | Partially preserved |
| Local Structure (Distances within clusters) | Poorly separated | Excellent separation | Excellent separation |
| Speed | Instant | Very Slow ( generally) | Fast (highly scalable) |
Choose PCA When
- You are feeding the output into another algorithm: If you want to compress 10,000 features down to 50 before running a classifier, use PCA. It is a true projection, meaning you can easily map new data points into the same space later.
- You care about absolute distances: In PCA, if point A is twice as far from point B as point C, that ratio holds true. Non-linear methods warp the space to force clusters apart, lying about the true distances.
Choose UMAP When
- You want to visualize complex data: Whether it's single-cell RNA sequencing data or a massive corpus of word embeddings, UMAP is the industry standard for squashing high-dimensional data into a beautiful 2D or 3D scatter plot. It reveals the topological structure of the data far better than PCA.
Choose t-SNE When
- You are reading older papers: t-SNE was the king of visualization from 2008 to 2018, so you will see it everywhere in the literature. However, for new projects, UMAP is strictly better mathematically, computationally, and visually.
What People Get Wrong
People often try to run clustering algorithms (like K-Means) directly on top of the 2D output of t-SNE or UMAP. This is extremely dangerous because these algorithms warp the space — the density and distance of the 2D map are artificial. You should run clustering on the original high-dimensional data (or PCA-reduced data) and only use UMAP to color the points for the visual plot.