Change Point Detection
Finding the exact moment in time when the underlying statistical properties (mean or variance) of a dataset permanently shifted, creating a 'new normal'.
Why Does This Exist?
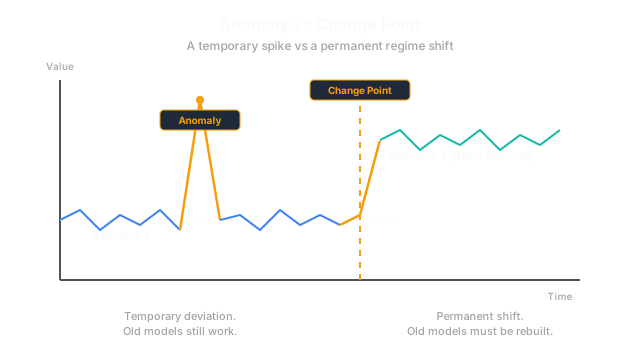
An anomaly is a one-time event. Your server CPU spikes to 100% for five minutes, and then returns to the normal 20%.
A change point (or structural break) is a permanent shift in reality. On Tuesday, your company releases a highly anticipated new product. Your website traffic goes from 10,000 visitors a day to 50,000 visitors a day, and it stays there forever.
If you try to run an Anomaly Detection algorithm on this data, it will flag Wednesday as an anomaly. It will flag Thursday as an anomaly. It will flag Friday as an anomaly. The algorithm is broken because it doesn't understand that the baseline has permanently changed. Change Point Detection algorithms exist to find the exact day the baseline shifted, so you can reset your models.
Think of It Like This
Think of It Like This
Imagine you are tracking your daily coffee expenses.
You usually spend $5 a day. One day you buy a round of coffees for your office and spend $50. The next day you go back to $5. That is an Anomaly.
Later that year, you get a new job in a much more expensive city. Your daily coffee now costs $8, every single day. The underlying environment has fundamentally shifted. That is a Change Point. Your budget models must immediately abandon the old $5 baseline and adopt the new $8 baseline.
How It Actually Works
Change Point algorithms scan the time series looking for points where the statistical properties before the point are significantly different from the statistical properties after the point.
1. CUSUM (Cumulative Sum)
This is a classical algorithm. It calculates the overall average of the entire dataset. It then steps through the data chronologically, keeping a running tally of how far the current data is from the overall average. If the data suddenly shifts upward, the running tally will quickly accumulate a massive positive sum. When the sum crosses a threshold, CUSUM flags a change point.
2. PELT (Pruned Exact Linear Time)
Modern data scientists usually use the PELT algorithm. It is designed to find multiple change points in a single dataset extremely quickly. It uses a cost function (like variance). It tries to divide the timeline into segments, attempting to minimize the variance inside each segment. If adding a new dividing line significantly drops the total variance, it establishes a change point.
Code
In Python, the ruptures library is the gold standard for Change Point Detection.
import numpy as npimport matplotlib.pyplot as pltimport ruptures as rpt
# 1. Create a dummy dataset with two distinct change points# Segment 1: Mean 10. Segment 2: Mean 20. Segment 3: Mean 5.signal_1 = np.random.normal(10, 1, 100)signal_2 = np.random.normal(20, 1, 100)signal_3 = np.random.normal(5, 1, 100)data = np.concatenate([signal_1, signal_2, signal_3])
# 2. Initialize the PELT algorithm # We tell it to look for shifts in the 'l2' (mean/variance) costalgo = rpt.Pelt(model="l2").fit(data)
# 3. Predict the change points# The 'pen' (penalty) parameter controls how sensitive it is.# A higher penalty means it will only flag massive, obvious shifts.change_points = algo.predict(pen=10)
print("Change points detected at indices:", change_points)# -> Change points detected at indices: [100, 200, 300]
# 4. Plot the resultsrpt.display(data, change_points, change_points)plt.show()Watch Out For
Stationarity is destroyed.
Classical forecasting models (like ARIMA) require strict Stationarity to work. A change point completely destroys stationarity because the mean is no longer constant. If a change point occurs, you generally must throw away all the historical data from before the change point, and only train your forecasting model on the data from the "new normal".
The Quick Version
- An anomaly is a temporary deviation. A change point is a permanent shift in the baseline (a "new normal").
- Algorithms like CUSUM and PELT scan the data to find the exact moment the mean or variance fundamentally shifted.
- Change points ruin classical forecasting models.
- When a change point is detected, you usually must reset your models and only train on data from the new regime.