Forecast Evaluation
The mathematical metrics used to grade how 'wrong' a forecasting model is. Different metrics punish different types of errors, such as massive outliers vs small consistent misses.
Why Does This Exist?
If a model predicts 100 sales, and the actual sales are 90, the error is 10. If it predicts 10 sales, and the actual sales are 0, the error is also 10.
But from a business perspective, missing by 10 on a baseline of 100 is a minor 10% miscalculation. Missing by 10 on a baseline of 0 means you stocked inventory that nobody bought, which is a 100% miscalculation.
You cannot judge a forecasting model with a single simple number. You must choose an evaluation metric that perfectly aligns with what your business actually cares about.
Think of It Like This
Think of It Like This
Imagine you are grading a student's math test.
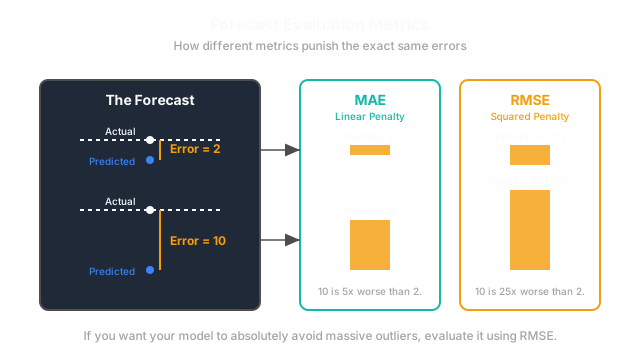
MAE (Mean Absolute Error): Every time they get a question wrong, you deduct 1 point. All mistakes are treated equally. RMSE (Root Mean Squared Error): You deduct 1 point for a small mistake, but if they get a question completely and wildly wrong, you deduct 10 points. You are aggressively punishing massive outliers. MAPE (Mean Absolute Percentage Error): You don't grade based on points, you grade on percentages. Missing a 1-point question is a big deal, but missing 1 point on a 100-point question is fine.
How It Actually Works
Here is a breakdown of the standard metrics used in the industry, and when to use them.
1. MAE (Mean Absolute Error)
It calculates the absolute difference between the forecast and reality, and averages it.
- When to use: When your business treats all errors linearly. If missing by 100 costs exactly 10x more than missing by 10, use MAE. It is highly robust to crazy outliers.
2. RMSE (Root Mean Squared Error)
It squares the errors before averaging them (and then takes the square root at the end).
- When to use: When massive failures are catastrophic. Because , but , RMSE heavily penalizes a model that occasionally makes gigantic mistakes. It forces the model to be consistently "okay" rather than mostly perfect with occasional disasters.
3. MAPE (Mean Absolute Percentage Error)
It divides the error by the actual value, giving you a percentage (e.g., "The model was off by 15% on average").
- When to use: When you need to explain the model to a CEO. Business executives understand "we have a 15% error rate" much better than "we have an RMSE of 4,201".
- The Fatal Flaw: If the actual value is , you divide by zero, and the math breaks. It also asymmetrical: if actual is 100 and you predict 200, error is 100%. If actual is 200 and you predict 100, error is 50%.
4. SMAPE (Symmetric MAPE)
Fixes the asymmetry of MAPE by dividing the error by the average of the actual and predicted values. It is heavily used in forecasting competitions (like M4).
5. MASE (Mean Absolute Scaled Error)
The most statistically rigorous metric. It scales your model's error against the error of a "Naive" model (a model that just blindly predicts that tomorrow will be exactly the same as today).
- When to use: If MASE > 1, your million-dollar neural network is literally worse than a model that says "tomorrow = today". If MASE < 1, you are genuinely adding value.
Code
In Python, scikit-learn provides most of these metrics.
import numpy as npfrom sklearn.metrics import mean_absolute_error, mean_squared_error, mean_absolute_percentage_error
actual = np.array([100, 150, 200, 50, 0])forecast = np.array([110, 150, 180, 90, 5])
# MAEmae = mean_absolute_error(actual, forecast)print(f"MAE: {mae}") # -> MAE: 15.0
# RMSErmse = np.sqrt(mean_squared_error(actual, forecast))print(f"RMSE: {rmse}") # -> RMSE: 20.61 (Higher than MAE because of the large miss on the 4th item)
# MAPE (Will be massive because the last item is 0, leading to a divide by zero error masked by a huge number)mape = mean_absolute_percentage_error(actual, forecast)print(f"MAPE: {mape * 100:.2f}%") Watch Out For
Don't use Point Metrics for Probabilistic Forecasts.
If you built a Probabilistic Model that outputs a distribution (P10 to P90), you cannot evaluate it with RMSE. You must use scoring rules designed for distributions, such as the CRPS (Continuous Ranked Probability Score).
The Quick Version
- You must evaluate your time series models using metrics that align with your business goals.
- MAE: Treats all errors linearly. Good for steady, robust evaluation.
- RMSE: Squares errors, heavily punishing massive outliers.
- MAPE: Outputs a percentage, easy for executives to understand, but breaks if actuals equal zero.
- MASE: Proves whether your complex model is actually better than a naive baseline.