Hierarchical Forecasting
A mathematical framework that ensures predictions made at the bottom level of a business (e.g., individual store sales) perfectly add up to the predictions made at the top level (e.g., total national sales).
Why Does This Exist?
In any large company, data is naturally grouped into a hierarchy.
- Level 1 (Top): Total National Sales
- Level 2 (Middle): Sales by State (California, Texas, New York)
- Level 3 (Bottom): Sales by Individual Store
If you ask your Data Science team to build a forecasting model for the total National Sales, they might predict $100 Million. If you ask them to build separate forecasting models for every individual store, and you sum all those individual predictions together, you might get $90 Million.
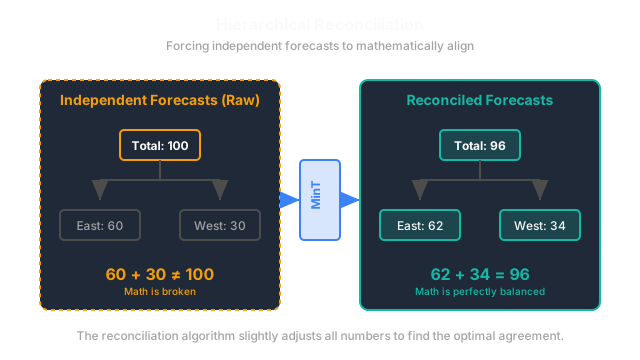
This is a massive problem. The CEO is looking at a dashboard that says $100M, but the regional managers are looking at dashboards that sum up to $90M. Hierarchical Forecasting is the process of mathematically forcing these separate forecasts to agree with each other (to be coherent).
Think of It Like This
Think of It Like This
Imagine predicting the final score of a football game.
You predict the total score will be 24 points (Top-Down). You also predict how many points each individual player will score (Bottom-Up): Player A scores 14, Player B scores 7, and Player C scores 7.
Wait. . The total score cannot be 24 if the players scored 28.
Hierarchical forecasting is the referee that looks at the discrepancy and adjusts the numbers. It might lower the total to 26 and bump the individual players down slightly until the math perfectly balances.
How It Actually Works
There are three classical ways to solve this problem, and one modern way.
1. Bottom-Up Forecasting
You only train models at the very bottom of the tree (individual stores). To get the National forecast, you simply add them all up.
- Pros: Mathematical alignment is guaranteed. Great for capturing local, store-level trends.
- Cons: Bottom-level data is usually very noisy and erratic. Adding up a bunch of noisy, inaccurate models often results in a terrible National forecast.
2. Top-Down Forecasting
You only train a single model at the very top (National level). You then look at historical proportions (e.g., California is usually 20% of national sales) and slice the National forecast into pieces to distribute to the stores.
- Pros: Top-level data is incredibly smooth and easy to predict accurately.
- Cons: It completely ignores new local trends. If a single store in Texas suddenly goes viral on TikTok, the Top-Down approach won't notice it.
3. Optimal Reconciliation (The Modern Approach)
Instead of choosing Top or Bottom, you predict everything. You build a model for the National level. You build models for the States. You build models for the Stores. Obviously, the math won't balance. You then pass all the raw predictions into a Reconciliation Matrix. Using linear algebra (often the MinT algorithm), it adjusts every single forecast simultaneously, shifting them up or down just enough so that everything perfectly aligns, while minimizing the total error.
Code
In Python, the HierarchicalForecast library by Nixtla is the industry standard for this exact problem.
import pandas as pdfrom hierarchicalforecast.core import HierarchicalReconciliationfrom hierarchicalforecast.methods import MinT
# Assume we have a dataframe 'Y_df' with the hierarchical structure defined,# and 'Y_hat_df' containing the RAW, un-reconciled forecasts at all levels.
# Initialize the MinT (Minimum Trace) reconciliation algorithmreconcilers = [ MinT(method='ols') # Ordinary Least Squares approach]
hrec = HierarchicalReconciliation(reconcilers=reconcilers)
# Pass the raw forecasts through the reconcilerY_rec_df = hrec.reconcile(Y_hat_df=Y_hat_df, Y_df=Y_df)
# Y_rec_df now contains the perfectly balanced forecasts.# If you sum the stores, it will exactly equal the state level.print(Y_rec_df.head())Watch Out For
Beware of missing structural data.
Hierarchical reconciliation relies entirely on knowing exactly which store belongs to which state, and which state belongs to which country. If a store physically moves across a state line mid-year, or if product categories are completely redefined, the entire summation matrix breaks down. Maintaining a pristine mapping table is harder than building the actual models.
The Quick Version
- Business metrics naturally form a hierarchy (Total Region Store).
- If you forecast these levels independently, the sum of the bottom will not equal the top.
- Bottom-Up adds up the lowest levels to get the total.
- Top-Down slices the total into smaller pieces based on historical percentages.
- Optimal Reconciliation forecasts every level independently and uses linear algebra to force them into alignment after the fact.