Latency vs Throughput
On this page
Overview
Performance metrics quantify how fast and how much a system can serve. The core metrics are latency (how long one request takes), throughput (how many requests complete per unit time), and response-time percentiles such as p50, p95, and p99 that describe the distribution of latency rather than a single average.
Key Concepts
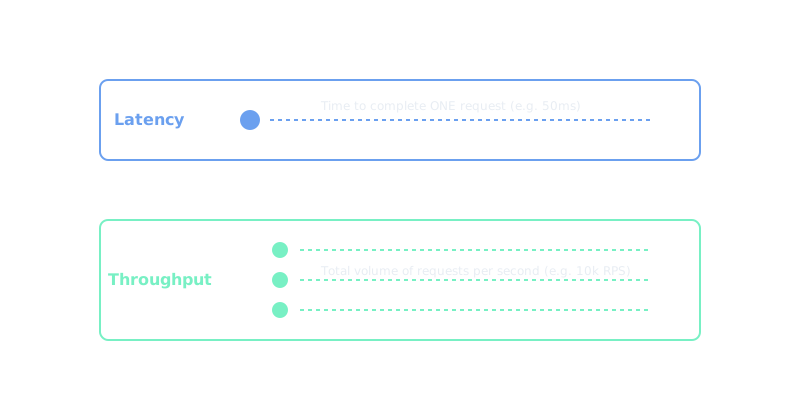
- Latency is the time to complete a single operation, usually measured end to end (client sends request until client receives response). It is often broken into network time, queueing time, and processing time. Lower is better, and it is reported in milliseconds.
- Throughput is the rate of completed work, commonly requests per second (RPS) or queries per second (QPS). Higher is better. Latency and throughput are related but distinct: a system can have low latency yet low throughput (one fast worker) or high throughput with high latency (many slow workers running in parallel).
- Response-time percentiles describe latency as a distribution. The pN percentile is the value below which N percent of requests fall:
- p50 (median): half of requests are faster than this - a "typical" experience.
- p95: 95 percent are faster; the start of the slow tail.
- p99: 99 percent are faster; the tail that hits your heaviest or unluckiest users.
Averages hide the tail - a few very slow requests barely move the mean but blow out p99. That is why teams track percentiles instead of averages.
Two levers move these numbers in complementary ways: a cache cuts latency by serving hot data from memory, while a load balancer raises throughput by spreading requests across many workers.
Trade-offs
| Metric | Optimizing it favors | Watch out for |
|---|---|---|
| Latency | Responsiveness per request | Micro-optimizations that add complexity |
| Throughput | Total capacity and cost efficiency | Batching and queueing can raise latency |
| Tail (p99) | Worst-case user experience | Expensive: needs headroom and warm caches |
Chasing throughput with large batches or deep queues often increases latency, and driving p99 down usually costs more capacity than driving p50 down. You decide which metric the design optimizes for based on what the product needs.
Interview Tips
- State targets as percentiles at a given load, not as averages.
- Say "tail latency" out loud and explain why p99 matters more than the mean.
- Tie each metric to a mechanism: percentile too high, cache or scale out reads; throughput too low, scale out.
- Sanity-check that your QPS target and latency target are mutually consistent with your capacity math.
Summary
- Latency is per-request time; throughput is completed requests per unit time.
- Percentiles (p50, p95, p99) reveal the latency distribution and the slow tail.
- Averages mask tail latency, so track p95 and p99.
- Latency and throughput can trade against each other; batching helps one and hurts the other.
- Express interview targets as percentiles at a stated load.