Metrics & Tracing
On this page
Overview
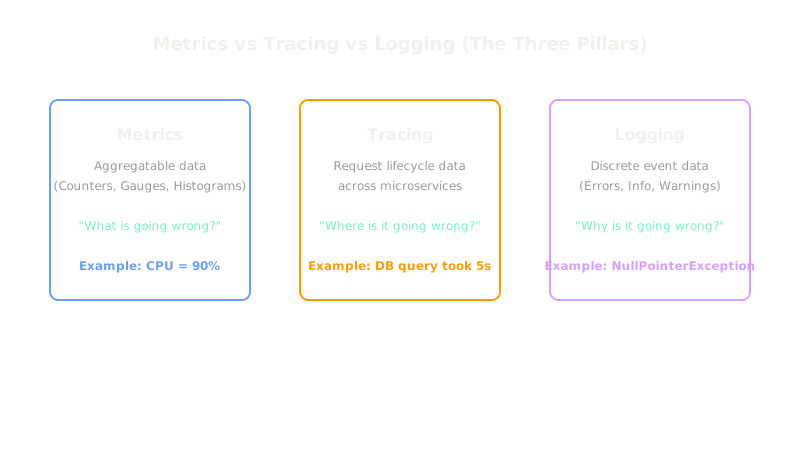
If logging tells you what happened, metrics tell you how much it's happening, and tracing tells you where it's happening. Together, these three form the "Three Pillars of Observability," essential for understanding the health and behavior of complex distributed systems.
Metrics are the patient's heart rate monitor (is the number too high or low?).
Tracing is the dye injected into the bloodstream to watch how blood flows through the heart (where is the blockage?).
Logging is the doctor's written notes on the clipboard (detailed context about the symptoms).
Key Concepts
Metrics (The "How Much")
Metrics are numeric representations of data measured over intervals of time. They are incredibly lightweight to store and query because they don't contain payloads, just numbers and tags (e.g., http_requests_total{status="500"} 42). They power dashboards and trigger alerts. Systems like Prometheus pull these metrics from applications.
The golden signals of metrics are:
- Latency: How long it takes to serve a request.
- Traffic: How much demand is placed on the system (e.g., requests per second).
- Errors: The rate of requests that fail.
- Saturation: How "full" your system is (e.g., CPU, Memory, Queue depth).
Tracing (The "Where")
In a microservices architecture, a single user click might touch 10 different services. If the request is slow, which service caused it? Distributed Tracing solves this by attaching a unique Correlation ID to the initial request. As the request moves from Service A to Service B to the Database, each step records a "span" containing that same ID, start time, and end time. Tools like Jaeger or Datadog stitch these spans together into a visual waterfall graph, showing exactly where the time was spent.
| Pillar | Data Type | Primary Use | Cost / Volume |
|---|---|---|---|
| Metrics | Numbers (Time-series) | Alerting & Dashboards (Is it broken?) | Very Low |
| Tracing | Spans (Waterfall graphs) | Bottleneck isolation (Where is it slow?) | Medium (Often sampled) |
| Logging | Strings (JSON) | Debugging (Why did it break?) | Very High |
Trade-offs
Metrics are cheap to keep for long periods, but lack context (you know that errors spiked, but not why). Tracing is incredible for debugging microservices but generates massive amounts of data; to save costs, systems usually employ sampling (e.g., only recording traces for 1% of successful requests, but 100% of failed requests).
Interview Tips
- Use the phrase "Correlation ID" when talking about tracing - it proves you understand how requests are tracked across network boundaries.
- When asked how to monitor a system, explicitly mention the "Golden Signals" (Latency, Traffic, Errors, Saturation).
- Point out that metrics drive the pagers/alerts, traces isolate the faulty service, and logs reveal the actual line of code that threw the exception.
Summary
- Metrics are numerical time-series data used for dashboards and triggering alerts.
- The Golden Signals for metrics are Latency, Traffic, Errors, and Saturation.
- Distributed Tracing follows a request across multiple microservices using a Correlation ID.
- Tracing produces waterfall graphs showing exactly where latency bottlenecks occur.
- Because tracing generates massive data, it is usually sampled (e.g., 1% of traffic).