Visual explainer
Anomaly Detection
How to spot the odd value out using standardized distance, isolation partitioning, and local neighbourhood density.
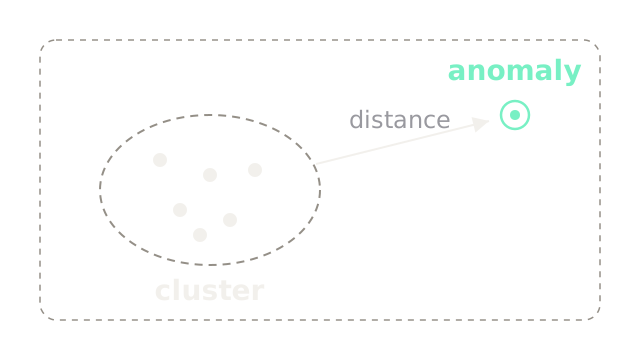
In unsupervised monitoring, you cannot enumerate every future failure mode or fraud pattern in advance. Instead, you model the routine cluster of standard observations and measure geometric distance to detect rare outsiders that fall far from the crowd.
Count the Steps
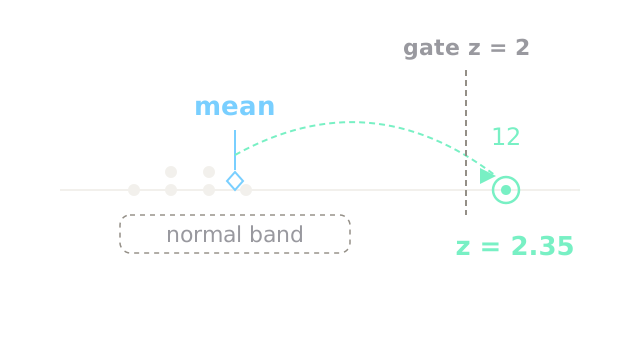
On a calibrated number line, raw values vary by scale, so distance is measured in standard deviations. Across seven observations , the sample mean is with a standard deviation of . While standard points remain within the 1-sigma normal band, value 12 lands at , easily crossing a decision threshold gate at .
Split It Fast
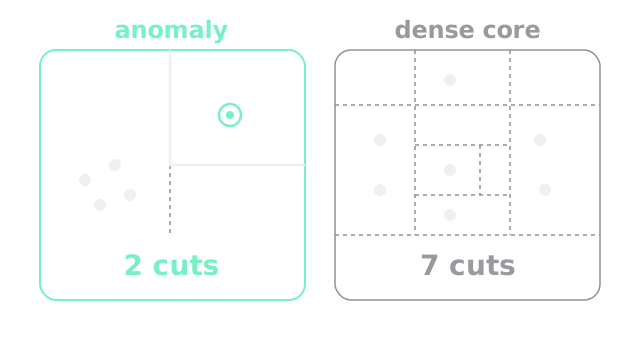
Isolation Forests partition feature space with random orthogonal cuts instead of computing distribution parameters. Because anomalies are sparse and distant, a solitary outlier requires only two random cuts to isolate into its own bounding box. In contrast, isolating a normal point packed within a dense cluster requires deeper recursive partitioning, taking seven cuts to separate from its neighbors.
Check the Neighbours
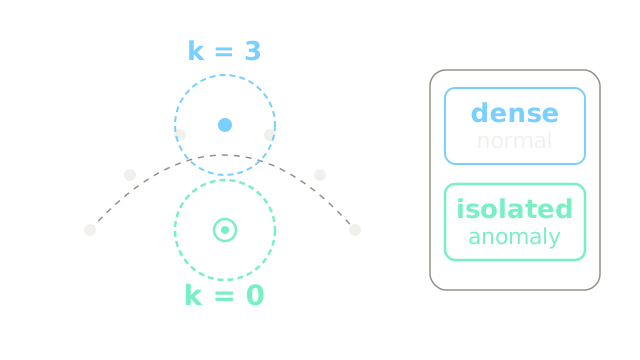
When data forms curved crescents or complex manifolds, global distance to the center of mass fails because the centroid lies in empty space. Local density methods inspect a fixed radius around each point. A point along the manifold counts three neighbors inside its probe circle (), confirming dense membership, whereas an outlier sitting in the hollow void contains zero neighbors ().
Hold the Transfer
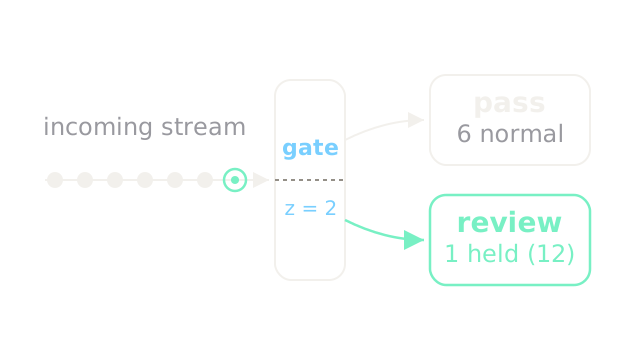
In production pipelines, automated threshold gating separates routine operations from high-risk events. The decision filter checks incoming scores against : six routine transactions pass through instantly without manual intervention, while the single anomalous transaction at value 12 is held for human quarantine and review.
Match the Shape
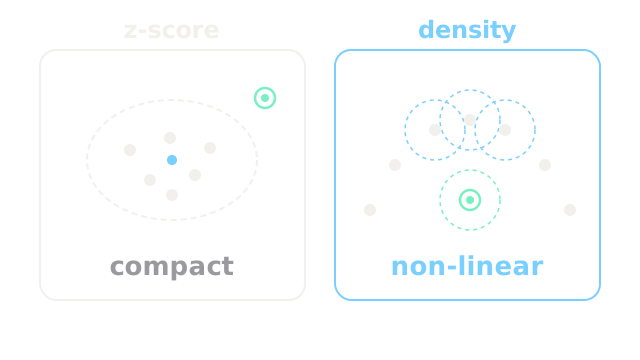
Parametric distance checks like z-scores compute in time and work well for compact, globular Gaussian clusters. However, when complex data forms non-linear curves or pockets, global elliptical boundaries flag legitimate points at the extremities. Switching to non-parametric density estimation or Isolation Forests fits the true manifold, preventing false alarms on bent geometries.
Where It Breaks
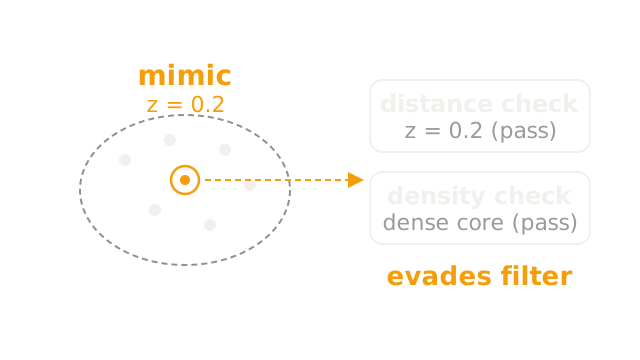
Statistical anomaly detection identifies spatial rarity and distance, not malicious intent. An adversary who mimics legitimate behavior lands at surrounded by normal neighbors. Because the transaction satisfies both distance and density checks, it evades statistical filters entirely. Defending against mimicry requires pairing anomaly scores with stateful behavioral rules and multi-factor authentication.
The Quick Version
- Normal observations cluster together while anomalies sit isolated in feature space.
- Standardized -scores measure distance in standard deviations; value 12 crosses the gate at .
- Isolation trees isolate sparse anomalies in few random cuts (2 cuts vs 7 cuts for crowded points).
- Fixed radius probe circles resolve non-linear crescents by verifying local neighbor density ( vs ).
- Automated screening filters routine traffic immediately while holding high-risk anomalies for review.
- Use fast parametric distance for compact clusters and density estimators for bent manifolds.
- Adversarial mimics inside the cluster core pass all statistical checks, requiring behavioral defense.