Visual explainer
SHAP & LIME
One applicant is denied without reason until a local line and exact credit shares show income adding 0.25 against debt subtracting 0.10.
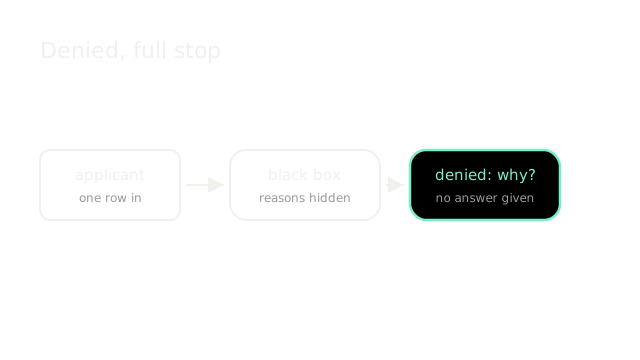
Your model denies one applicant and approves the next, offering no reason either way. Accuracy without reasons leaves you helpless when the applicant asks why, and soon a regulator does too, with tougher questions.
Nearby Points Decide
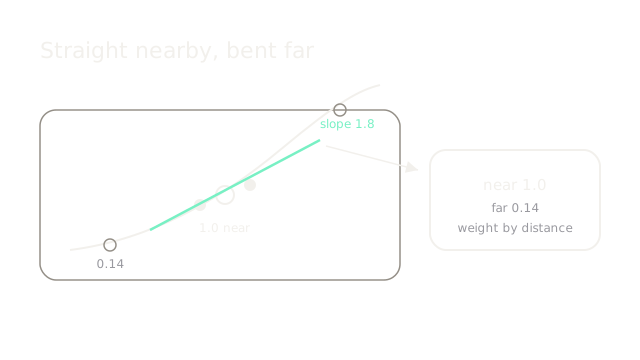
You scatter sample applicants around this one, weighing the near ones 1.0 and the far ones 0.14. A straight line of slope 1.8 fits that weighted neighborhood. Each income step adds that much nearby, all else held equal.
Credits Sum Exactly
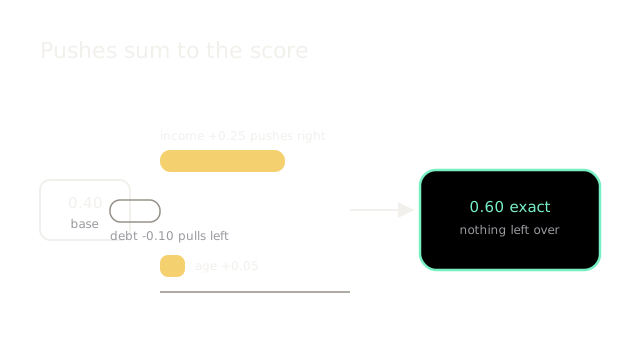
Start from the base rate 0.40, add income at 0.25, subtract debt at 0.10 and add age at 0.05. The shares land exactly on the model's 0.60, which is the whole promise of additive credit.
Two Lenses Agree
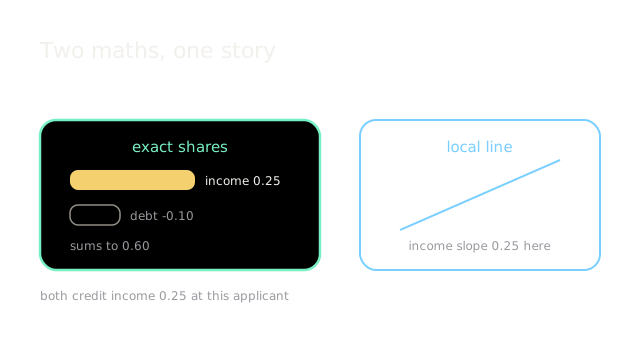
The line credits income 0.25 near this applicant; the exact shares agree at 0.25. Two different maths, one local story you can trust further than either alone.
Reasons Get Ranked
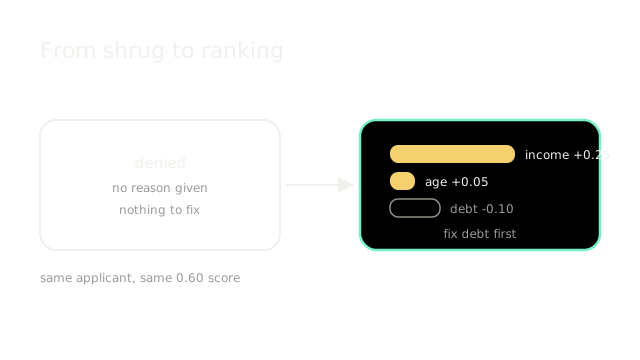
Before, the applicant gets a bare denial. After, income tops the list at plus 0.25 and debt trails at minus 0.10, ready to discuss and fix together.
Debug or Prove
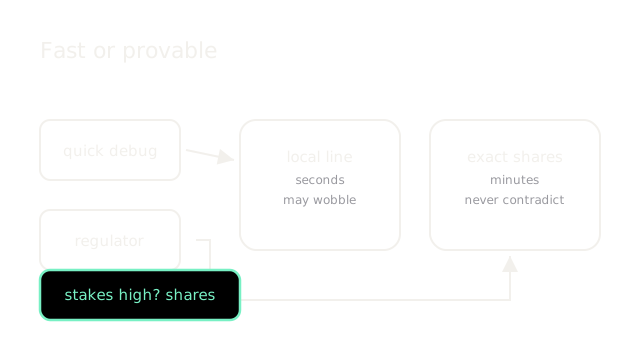
Debugging fast? Fit a local line in seconds. Proving fairness to a regulator? Pay for exact shares that never contradict each other across similar applicants.
Where It Breaks
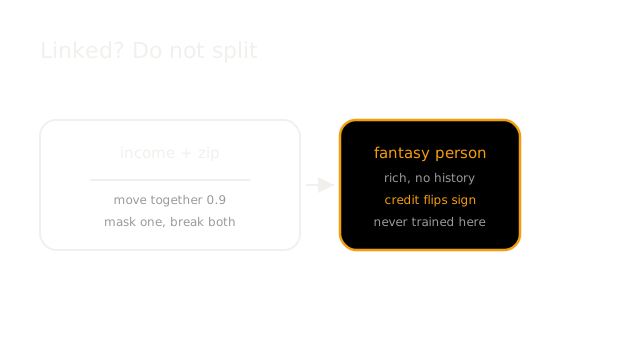
Income and zip move together at 0.9, so hiding income invents an executive with no pay history. Off-distribution fantasies earn wild credits you cannot trust or ship to anyone.
The Quick Version
- Denials arrive with no reasons.
- Near samples weigh 1.0, far 0.14.
- Shares sum exactly to 0.60.
- Line and shares agree at 0.25.
- Income tops reasons at 0.25.
- Debug with lines; prove with shares.
- Correlated masks invent fantasy people.
What to Read Next
- Decision TreesHow yes-or-no questions carve space into rectangles, with a Gini drop from 0.50 to 0.32 shown.
- Model EvaluationWhy you cannot trust training scores and how train, validation, and test splits keep you honest.
- Linear RegressionFit a straight line through scattered data points by minimising the vertical errors, giving a single trend for prediction.