Dimensionality Reduction
How to squash high-dimensional data into a human-readable 2D map.
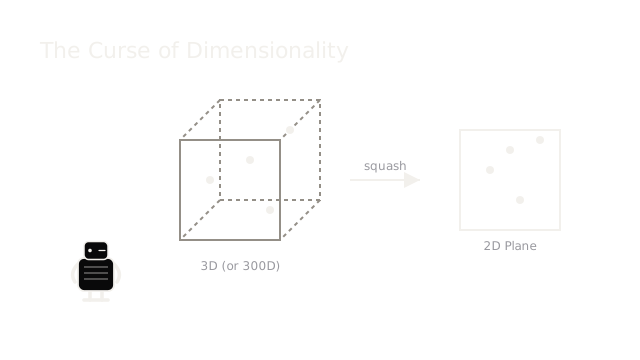
Raw data often has hundreds of dimensions—every pixel in an image or every word in a document. We cannot see beyond three dimensions, and math gets extremely expensive in high dimensions. We need to squash it down.
PCA: Maximum Variance
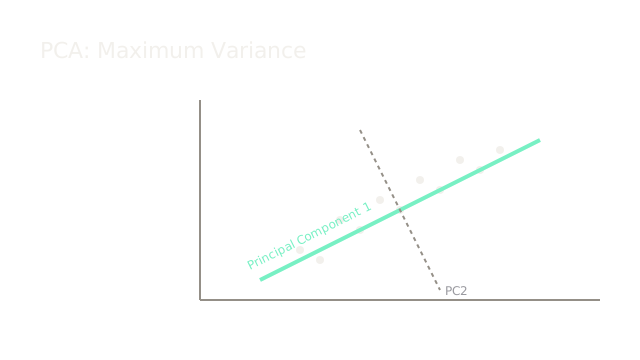
Principal Component Analysis (PCA) looks at the entire dataset at once and draws a rigid line through the widest spread of the data. It preserves the global shape by finding the axes of maximum variance.
t-SNE: Local Neighbors
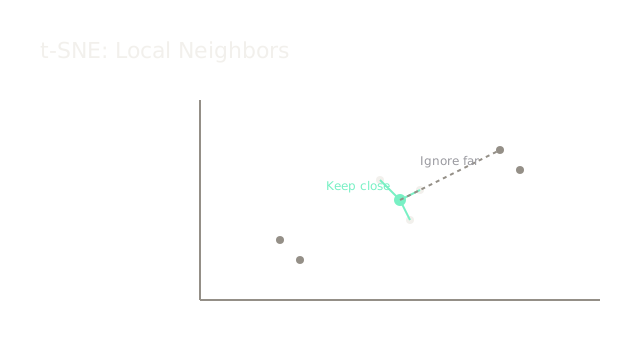
Instead of rigid axes, t-SNE asks every point who its nearest neighbors are. It then tries to place points on a 2D map so those specific neighbors stay close, letting the global shape warp or tear if necessary.
The Result: A 2D Map
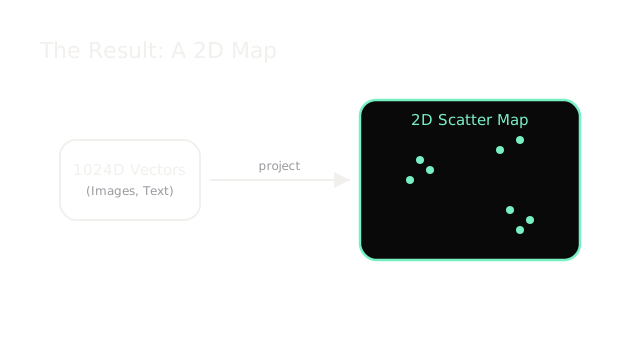
When you project complex embeddings down to two dimensions, the abstract concepts turn into a scatter map. You can visually inspect the landscape of your data, spotting natural clusters or outliers.
Where It Breaks
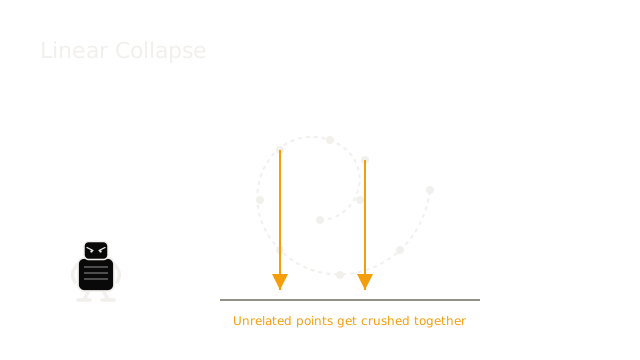
If your data is curved or rolled up like a spiral, linear methods like PCA will crush it flat, overlapping points that are actually far apart along the curve. You need non-linear methods (like t-SNE or UMAP) to unroll the shape.
The Quick Version
- The curse: High dimensions are unreadable and expensive.
- PCA: Finds the rigid axes where data spreads the most.
- t-SNE: Ignores rigid axes to keep local neighbors together.
- The payoff: A 2D scatter map of complex data.
- The limit: Linear methods crush curved manifolds incorrectly.