Linear Regression
Fit a straight line through scattered data points by minimising the vertical errors, giving a single trend for prediction.
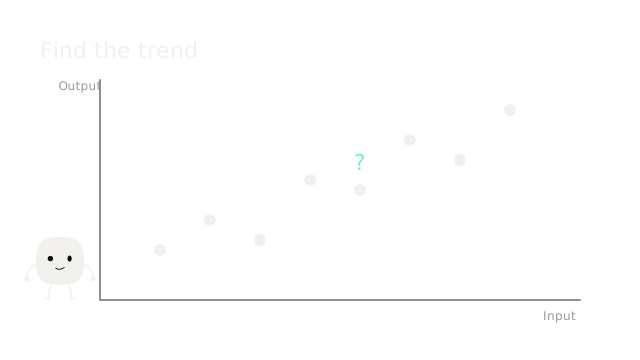
When data scatters across a chart, you need a single rule to summarise it. You want to draw the one straight line that captures the central tendency, cutting through the noise.
Just Two Numbers
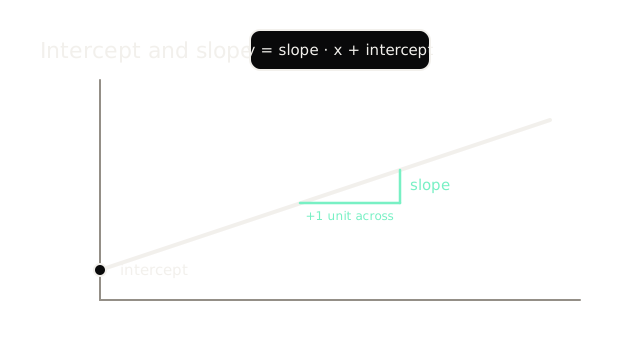
Any straight line is fully described by an intercept and a slope. The model doesn't memorise the data; it just learns these two numbers.
Minimise the Errors
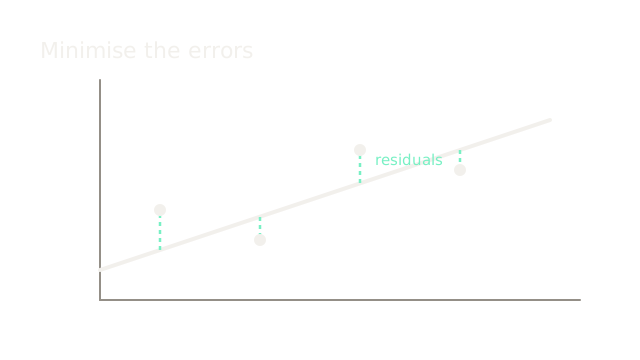
The best line is the one that sits closest to all points simultaneously. It minimises the sum of the squared vertical distances — the residuals — between the real data and the prediction.
Predicting the Unseen
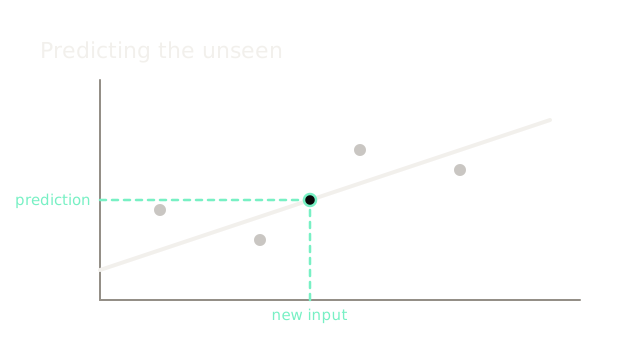
With the line locked in place, you can drop any new input onto the horizontal axis, trace it up to the line, and read the predicted output off the vertical axis.
Where It Breaks
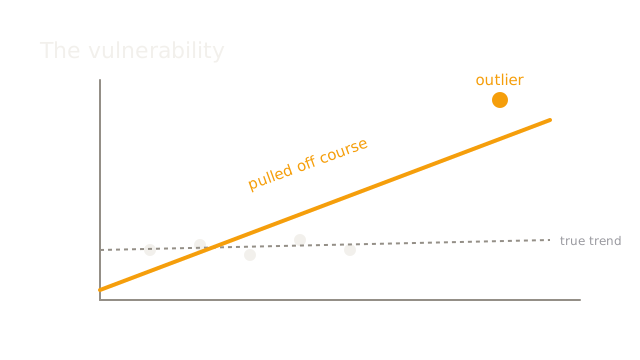
Because the line cares about squared errors, a single point that lies far away pulls disproportionately hard. One bad outlier will tilt the entire line away from the true trend.
The Quick Version
- You need one trend for scattered data.
- A line is just a slope and an intercept.
- The fit minimises the vertical errors.
- New predictions just read off the line.
- Outliers drag the whole line off course.