Anomaly Detection
Finding rare rows that do not belong differs from finding outliers in one column, and the wrong metric can make a detector that misses everything look perfect.
Why Does This Exist?
Outlier detection tells you a value in one column is far from the rest of that column. Real fraud, intrusion, and equipment-failure problems rarely announce themselves in one column — they show up as a row that's ordinary on every axis you'd check individually and wrong only in combination, or as a rare class you're specifically trying to catch rather than a decimal point to fix.
Here's the case we'll carry down the page. A payments team monitors 2,000 transactions a day, and roughly 2% turn out fraudulent. A model that predicts "not fraud" on every single transaction, never even looking at the data, scores 98% accuracy — a number that sounds like success and represents doing nothing at all. Anomaly detection is the discipline built around exactly this trap: finding the rare rows that matter, and reporting that finding with a metric that can't be fooled by how rare they are.
Think of It Like This
A lifeguard who never once shouts
A beach has one lifeguard watching for swimmers in trouble, and on 98 days out of 100 nobody needs help. A lifeguard who simply never raises the alarm is "right" 98% of the time by pure arithmetic — and utterly useless, since the two days that mattered are exactly the two days they said nothing.
Grading the lifeguard by "percentage of days with no incorrect call" rewards silence. Grading them by "of the actual emergencies, how many did you catch, and how many false alarms did you raise along the way" measures the job they were actually hired to do. Anomaly detection systems get graded the second way for the same reason: the easy 98% was never the point.
How It Actually Works
Three families, one shared assumption
Every anomaly detector assumes normal behavior is common and anomalous behavior is rare, then looks for deviation from that norm in one of three ways. Statistical methods flag points far from a fitted distribution — a z-score or Mahalanobis distance past a threshold, the same machinery outlier detection uses column by column, generalized to the whole row. Proximity-based methods flag points whose neighbors are unusually sparse or distant — density estimates or nearest-neighbor distances that stay low for normal points and spike for anomalies. Model-based methods fit a model of what normal data looks like and flag anything that model can't explain well — isolation forest and one-class SVM both live here, differing in exactly how they characterize "normal".
Point, contextual, and collective anomalies
Not every anomaly looks the same shape. A point anomaly is a single row that's unusual on its own — one transaction for an implausible amount. A contextual anomaly is a row that's only unusual given its context — a heating bill that's normal in January and anomalous in July, where the value never changes but the surrounding context does. A collective anomaly is a group of rows that's unusual only as a group — a sequence of logins that are each individually plausible but collectively describe a pattern no single one would flag alone. Most off-the-shelf detectors target point anomalies by default; contextual and collective cases usually need the context or the sequence engineered into the features before any of the three families above can see them.
Why accuracy actively hides the problem
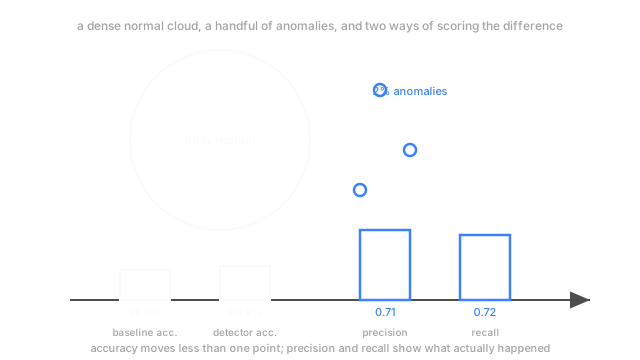
With a base rate of 2% fraud, the "always predict normal" baseline scores 98% accuracy while catching zero fraud — and a real detector that catches most fraud, at the cost of some false alarms, can score a lower raw accuracy than that baseline while being the only one of the two actually doing the job. Accuracy averages over both classes, and when one class outnumbers the other 49 to 1, the majority class's near-perfect score swamps whatever happens on the minority class entirely. Precision and recall, scored specifically on the rare class, are what any anomaly detector's success actually has to be measured against — the same discipline imbalanced data requires everywhere a rare class matters more than its share of the rows.
Code
A 2% anomaly rate, scored against the do-nothing baseline that "wins" on accuracy alone.
import numpy as npfrom sklearn.ensemble import IsolationForestfrom sklearn.metrics import accuracy_score, precision_score, recall_score
rng = np.random.default_rng(7)n_normal, n_anomaly = 2000, 40 # a realistic 2% anomaly ratenormal = rng.normal(0.0, 1.0, (n_normal, 2))anomaly = rng.uniform(-6.0, 6.0, (n_anomaly, 2))x = np.vstack([normal, anomaly])y_true = np.r_[np.zeros(n_normal), np.ones(n_anomaly)]
always_normal_acc = accuracy_score(y_true, np.zeros(len(y_true))) # the do-nothing baselinedetector = IsolationForest(contamination=0.02, random_state=0).fit(x)flagged = (detector.predict(x) == -1).astype(int)
print(f"predicting 'always normal': accuracy {always_normal_acc:.4f}")print(f"isolation forest: accuracy {accuracy_score(y_true, flagged):.4f}")print(f"isolation forest: precision {precision_score(y_true, flagged):.2f} recall {recall_score(y_true, flagged):.2f}")# -> predicting 'always normal': accuracy 0.9804# -> isolation forest: accuracy 0.9887# -> isolation forest: precision 0.71 recall 0.72The do-nothing baseline already scores 98.04% — a real detector's 98.87% looks like a marginal improvement by that measure alone, even though it's catching roughly 72% of every anomaly the baseline missed entirely. Accuracy compresses that entire story into a one-point difference; precision and recall tell you what actually happened.
Watch Out For
Reporting accuracy on a rare-event detection problem
The single most reliable way to make a useless detector look successful: report accuracy on data where the event of interest is rare, and the majority class's sheer size does the flattering for you automatically. A stakeholder reading "98.87% accurate" has no way to know that number would barely move if the detector caught nothing at all. Report precision, recall, or a rare-class-specific metric alongside — never accuracy alone — whenever the base rate is far from 50/50.
Treating a point-anomaly detector as if it handles contextual or collective cases
A model trained to flag unusual single rows has no mechanism to notice that a value is normal in one context and anomalous in another, or that a sequence of individually-fine events adds up to something wrong. Feeding it raw values without the surrounding context or sequence engineered in produces a detector that silently can't see the anomaly type it was never built to catch — not a bug, but a scope mismatch between the method and the problem.
The Quick Version
- Anomaly detection finds rare, unusual rows rather than unusual values in a single column, and often targets a rare class rather than a data-entry error.
- Three families do the work: statistical (distance from a fitted distribution), proximity-based (density or nearest-neighbor distance), and model-based (isolation forest, one-class SVM).
- Point, contextual, and collective anomalies are different shapes of the same problem; most default detectors target point anomalies only.
- With a low base rate, accuracy can barely move between a useless baseline and a genuinely effective detector — precision and recall on the rare class are what to report instead.
- Accuracy on an imbalanced detection problem isn't just uninformative; it's actively misleading, since the majority class's size does the flattering.