Causal Graphs
A causal graph is a map of how the world works. It tells you which variables to control for, and more importantly, which variables you must ignore to find the true effect.
Why Does This Exist?
In the early days of statistics, researchers tried to solve confounding by simply controlling for every variable they could measure. This "kitchen sink" approach to regression often makes things worse. Adding the wrong variable to a model can actively create spurious correlations that didn't exist in the raw data, completely destroying your ability to measure the true causal effect.
Causal graphs (specifically, Directed Acyclic Graphs, or DAGs) exist to solve this variable selection problem. They give us a visual, mathematical language to write down our assumptions about how data was generated. Once the graph is drawn, simple graphical rules tell us exactly which variables we must include in our model, and which variables we must exclude, to isolate the true causal effect.
Think of It Like This
Imagine a plumbing system where water flows through pipes from a source to a drain.
Think of It Like This
You want to measure how much water flows directly from Pipe A to Pipe B. But the plumbing is a mess: there are hidden pipes leaking water into both, and downstream pipes where the water mixes. A causal graph is the blueprint of the plumbing. By looking at the blueprint, you know exactly which valves to shut off (control for) to isolate the direct flow, and which valves to leave alone so you don't accidentally flood the system.
How It Actually Works
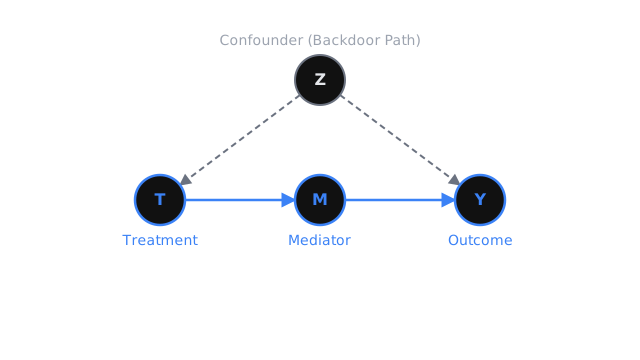
A causal graph consists of nodes (variables) and directed edges (arrows). An arrow from means that changing physically or logically changes . The graph must be acyclic, meaning you cannot follow arrows and end up back where you started; time only flows forward.
When we want to know the effect of a treatment on an outcome , we are looking for the direct and indirect causal paths that start at and end at with all arrows pointing forward.
However, correlation can flow backwards. A path like creates a spurious correlation between and . This is a backdoor path.
The Backdoor Criterion
To find the true causal effect of on , we must block all spurious correlation while leaving all true causal paths open. We do this by applying the Backdoor Criterion. A set of variables satisfies the backdoor criterion if:
- No node in is a descendant of (don't control for things that happen after the treatment).
- blocks every path between and that contains an arrow pointing into .
If we can observe and control for a set that meets these conditions, then the conditional probability equals the causal probability .
d-separation
How do we know if a path is "blocked"? A path is blocked (d-separated) if it contains any of the following structures:
- A chain , and we condition on the middle node .
- A fork , and we condition on the middle node .
- A collider , and we do not condition on the middle node .
The collider is the trap. If two independent causes both influence a third variable, they are uncorrelated. But if you condition on that shared effect (the collider), you actively force the two causes to become correlated. This is why the "kitchen sink" regression approach fails: controlling for a collider opens a blocked path, introducing bias.
Code
We can use the networkx library to draw a causal graph and visually inspect the paths, though in practice, specialized causal libraries like DoWhy handle the graphical identification for you.
import networkx as nx
# Define the causal graph (Directed Acyclic Graph)G = nx.DiGraph()
# Add edges: (Cause, Effect)# Z is a confounder, W is a mediator, C is a colliderG.add_edges_from([ ("Z", "Treatment"), ("Z", "Outcome"), ("Treatment", "W"), # Causal path: Treatment -> W -> Outcome ("W", "Outcome"), ("Treatment", "C"), # Collider: Treatment -> C <- Outcome ("Outcome", "C")])
def check_backdoor(graph, treatment, outcome, conditioning_set): """ A simplified check for whether controlling for a set blocks the spurious path T <- Z -> Y. """ print(f"Conditioning on: {conditioning_set}") # 1. Did we condition on a descendant of treatment? descendants = nx.descendants(graph, treatment) for var in conditioning_set: if var in descendants: print(f"FAIL: {var} is caused by {treatment} (Mediator or Collider).") return False # 2. Did we block the confounder? if "Z" not in conditioning_set: print("FAIL: Confounder Z is unblocked. Spurious path remains.") return False print("SUCCESS: Backdoor paths blocked. Causal effect is identifiable.") return True
# Scenario 1: Control for nothing (Kitchen Sink = False)check_backdoor(G, "Treatment", "Outcome", [])# -> FAIL: Confounder Z is unblocked.
# Scenario 2: Control for the confounder Zcheck_backdoor(G, "Treatment", "Outcome", ["Z"])# -> SUCCESS: Backdoor paths blocked.
# Scenario 3: Control for Z, but also control for W (a mediator)check_backdoor(G, "Treatment", "Outcome", ["Z", "W"])# -> FAIL: W is caused by Treatment. We blocked the actual causal effect!Watch Out For
Unobserved Confounders.
The backdoor criterion only works if you have data for the variables in the set . If your graph says you must control for "User Motivation" to block a backdoor path, but you don't have a metric for motivation, the causal effect is unidentifiable through standard adjustment. You must turn to advanced techniques like Instrumental Variables.
The graph is an assumption, not a fact.
You cannot usually learn the causal graph from the data alone (though causal discovery algorithms try). The arrows represent domain knowledge—physics, biology, business logic. If your graph is wrong, your causal estimates will be wrong, no matter how rigorous your math is.
The Quick Version
- A causal graph (DAG) maps out the cause-and-effect relationships between variables.
- We want to isolate the forward-pointing paths from Treatment to Outcome.
- Backdoor paths (paths that start with an arrow pointing into the Treatment) create spurious correlations and must be blocked.
- We block backdoor paths by conditioning on the right variables, defined by the Backdoor Criterion.
- Conditioning on a collider (a node where two arrows meet) actively creates bias by opening a previously blocked path.