Statistical Significance in Evaluation
Because models are trained using random seeds and evaluated on limited data samples, performance metrics are distributions, not single numbers. You must report intervals to prove an improvement is real.
Why Does This Exist?
Imagine you train a baseline model and it achieves 84.1% accuracy. You then spend three weeks inventing a novel architectural tweak, train the new model, and it achieves 85.5% accuracy. You celebrate a 1.4% improvement and ship the code.
If you had just retrained the baseline model with a different random seed, it might have achieved 85.6%. You spent three weeks shipping a random fluctuation.
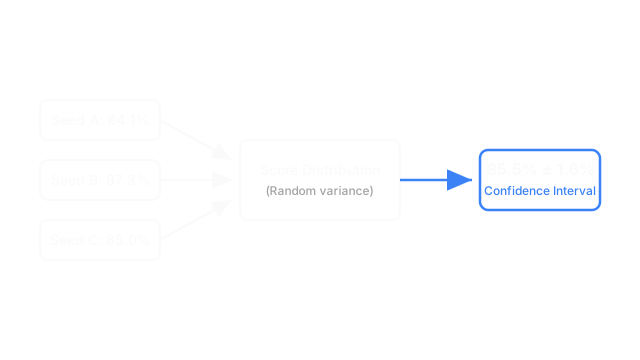
Statistical significance in evaluation exists to prevent you from being fooled by randomness. Every machine learning pipeline is infused with noise: the random initialization of weights, the random shuffling of training batches, and the random selection of the test set from the true population. Because of this noise, a model's "true" performance is never a single point estimate (like 85.5%). It is a probability distribution.
If you report a single number, you are lying to yourself and your stakeholders. You must calculate and report a confidence interval (e.g., ) to prove that your new model's distribution is genuinely better than the baseline's distribution.
Think of It Like This
Think of model evaluation like measuring the average height of a city's residents.
You cannot measure every single person, so you take a random sample of 1,000 people and calculate an average of 5'9". If you take a different random sample of 1,000 people tomorrow, the average might be 5'10". The true average height of the city did not change overnight; your measurement merely fluctuated because of the sample you drew.
If someone claims a new diet increased the city's average height by half an inch, you cannot just compare two single measurements. You have to prove that the difference is larger than the natural fluctuation of the sampling process.
How It Actually Works
To establish statistical significance, you need to understand the variance in your evaluation pipeline. There are two primary sources of variance, and they require different statistical tools to measure.
1. Seed Variance (Model Instability)
If you train a neural network multiple times on the exact same dataset but use a different random seed for weight initialization and batch shuffling, you will get a different final model each time. In some architectures (like deep reinforcement learning or small transformers), this variance is massive.
To measure seed variance, you must train the model multiple times (e.g., 5 to 10 runs). You evaluate all 5 models on your test set, and you calculate the mean and standard deviation of those 5 scores. If Model A scores across seeds, and Model B scores , they are statistically indistinguishable.
2. Sample Variance (Data Instability)
Even if you have a perfectly deterministic model (like a Random Forest with a fixed seed, or a frozen LLM accessed via API), you still face sample variance. Your test set is just one small slice of all possible real-world data. If you drew a different test set, the model would get a different score.
To measure sample variance without collecting new data, practitioners use bootstrapping.
- You take your existing test set of examples.
- You randomly sample examples from it with replacement (meaning some examples are duplicated, and some are left out). This creates a "bootstrap sample."
- You calculate your metric (e.g., F1 score) on this bootstrap sample.
- You repeat this process 1,000 times to create 1,000 different F1 scores.
- You sort those 1,000 scores and take the 2.5th and 97.5th percentiles. This gives you a 95% confidence interval for your model's performance.
If the 95% confidence interval of your new model overlaps significantly with the confidence interval of the baseline, the improvement is not statistically significant.
Code
Here is how you compute a 95% confidence interval using the bootstrap method on a frozen model's predictions.
import numpy as npfrom sklearn.metrics import accuracy_score
def compute_bootstrap_interval( y_true: np.ndarray, y_pred: np.ndarray, n_iterations: int = 1000, alpha: float = 0.05) -> tuple[float, float, float]: """ Computes the mean accuracy and the 95% confidence interval via bootstrapping. """ n_samples = len(y_true) bootstrap_scores = [] for _ in range(n_iterations): # Sample with replacement indices = np.random.randint(0, n_samples, n_samples) sample_true = y_true[indices] sample_pred = y_pred[indices] # Compute metric score = accuracy_score(sample_true, sample_pred) bootstrap_scores.append(score) # Calculate mean and percentiles mean_score = np.mean(bootstrap_scores) lower_bound = np.percentile(bootstrap_scores, (alpha / 2) * 100) upper_bound = np.percentile(bootstrap_scores, (1 - alpha / 2) * 100) return mean_score, lower_bound, upper_bound
# -> (0.855, 0.839, 0.871) # Reported as 85.5% (95% CI: 83.9% - 87.1%)Watch Out For
The P-Value Illusion
In classic statistics, people rely heavily on p-values to prove significance. In modern machine learning, p-values are dangerously misleading. If your test set is massive (e.g., 1 million examples), a tiny, completely irrelevant improvement of 0.01% will have a highly significant p-value (). A significant p-value only means the difference is real; it does not mean the difference is large enough to matter in production. Always focus on effect sizes and confidence intervals instead.
Hiding the Variance
A common anti-pattern is for researchers to train a model with 5 different seeds, pick the single highest score among the 5, and report that number in the paper. This is statistical malpractice. It guarantees that the reported number is an outlier driven by luck. You must report the mean and the standard deviation across the runs.
The Quick Version
- Because of random weight initialization, data shuffling, and test set sampling, model performance is a probability distribution.
- A single point estimate (like 85.5%) hides this variance and leads teams to ship models that are not actually better.
- To measure model instability, you must train the model multiple times with different random seeds.
- To measure test set instability, you use bootstrapping: repeatedly sampling your test set with replacement to build a confidence interval.
- If the confidence intervals of two models heavily overlap, the difference between them is statistically meaningless, regardless of what the mean score says.