LLM Observability
Debugging an LLM application without observability is like debugging a program without a stack trace. LLM observability gives you a structured, searchable record of exactly what happened at every layer of every request — tokens used, latency, prompt version, tool calls, and cost.
Why Does This Exist?
Traditional web application observability is straightforward: an HTTP request either succeeds or fails, and you can trace it through logs. LLM applications are different in three ways that break the standard tooling.
First, LLM calls are expensive and non-deterministic — the same prompt can produce different outputs, so you can't predict failures ahead of time. Second, a single user request often fans out into multiple model calls, tool invocations, and retrieval steps. Third, the output quality can degrade silently — the model still responds, but the answer is wrong, evasive, or off-topic, which no HTTP status code will tell you.
LLM observability addresses all three by recording structured data about every step of every request: what went in, what came out, how long it took, how much it cost, and which version of the prompt and model was used.
Think of It Like This
Think of It Like This
A flight's black box records everything: altitude, speed, engine state, pilot inputs, every instrument reading. It doesn't tell you there's a problem while the plane is flying — it tells you exactly what happened after something goes wrong. LLM observability is the black box for your AI application. When a user reports "your chatbot told me something weird on Tuesday evening", the trace for that specific request is the thing that tells you which prompt fired, which model answered, what it said, and why it said it.
The Span Model
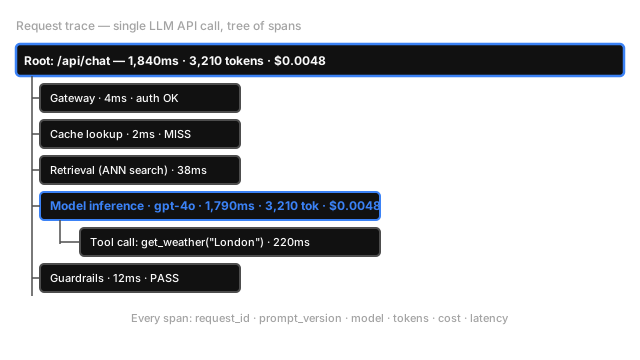
LLM observability builds on OpenTelemetry's distributed tracing model. A trace is the full record of one user request. It contains a tree of spans, where each span represents one unit of work.
The key spans in an LLM application:
| Span | What it records |
|---|---|
| Root (API request) | Total latency, user ID, tenant, request ID |
| Model inference | Model name+version, input tokens, output tokens, TTFT, cost |
| Tool call | Tool name, arguments, return value, latency |
| Retrieval | Query, top-k results, similarity scores, latency |
| Guardrails | Input/output inspected, verdict, latency |
| Cache | Cache strategy, hit/miss, key used |
Every span carries the same request_id and prompt_version, so you can reconstruct the full picture from any starting point.
Minimum Fields to Log
Don't overthink the schema. These eight fields, logged on every model call, cover 90% of debugging scenarios:
import timefrom openai import OpenAIimport uuid
client = OpenAI()
def traced_llm_call(prompt: str, prompt_slug: str, prompt_version: int) -> str: request_id = str(uuid.uuid4()) start = time.perf_counter()
response = client.chat.completions.create( model="gpt-4o-mini-2024-07-18", messages=[{"role": "user", "content": prompt}], )
elapsed_ms = (time.perf_counter() - start) * 1000 usage = response.usage
# Structured log — every field is searchable structured_log = { "request_id": request_id, "model": "gpt-4o-mini-2024-07-18", "prompt_slug": prompt_slug, "prompt_version": prompt_version, "input_tokens": usage.prompt_tokens, "output_tokens": usage.completion_tokens, "latency_ms": round(elapsed_ms, 1), "cost_usd": round( usage.prompt_tokens * 0.00000015 + usage.completion_tokens * 0.0000006, 6 ), } logger.info("llm_call", extra=structured_log) return response.choices[0].message.contentWhat to Query
The real value comes from aggregating across requests:
- Cost per day by tenant — who's burning budget fastest?
- P99 latency by model — is the large model actually staying within the latency budget?
- Token usage by prompt version — did the new prompt use more tokens than the old one?
- Error rate by endpoint — which feature is hitting the most 429s?
- Guardrail trigger rate — is the spike in blocked outputs a prompt problem or a user behaviour change?
Tools like LangSmith, Langfuse, Helicone, and Arize Phoenix are purpose-built for these queries. They ingest your traces and provide dashboards, alert triggers, and prompt version diff views.
Watch Out For
Logging the full prompt and response in production.
The temptation is to log everything, including the complete input and output text. In many applications, this is a PII violation — user names, medical information, and financial data end up in your logging system, which may not have the same data-retention controls as your main database. Log token counts, not content. If you need to log content for debugging, do it behind a feature flag on sampled traffic only, with explicit data-handling rules.
The Quick Version
- LLM observability records structured data about every request as a trace made of nested spans.
- Each span captures: model version, prompt version, input/output tokens, cost, latency, and any tool calls.
- Aggregate traces to answer: who's spending money, what's slow, which prompts are breaking, and when did quality drop.
- Use purpose-built tools (LangSmith, Langfuse, Helicone) rather than generic logging — they understand the LLM span schema.
- Never log full prompt/response text in production without a PII scrubber.