Principal Component Analysis
Turn the coordinate axes until the first runs along the direction your data spreads most, then delete the axes that barely move. That is the entire method.
Why Does This Exist?
An apple grading line hands you twelve numbers per apple: weight, diameter, height, firmness, sugar in Brix, three colour channels, some blemish counts. Plot any two and you hit something annoying — weight and diameter draw almost the same picture, because a wide apple is a heavy apple. Twelve columns, maybe five ideas.
PCA finds how many ideas there really are, and hands you new columns that don't repeat each other. Why you'd want fewer columns at all — distance stops working in high dimensions, the plots you can't draw — is dimensionality reduction. This page is one method.
Two ideas to have in hand. Variance along a direction is how spread out your apples are measured along it, nothing more (the full treatment). An eigenvector of a matrix is a direction the matrix only stretches, never turns; the stretch factor is its eigenvalue (more here).
Think of It Like This
The biggest shadow a hammer can cast
Put a claw hammer under a bright lamp and watch its shadow on the wall. Handle pointed at the wall gives a stubby blob. Turn it side-on and the shadow stretches, showing the whole handle and the claw.
That long shadow is the first principal component: the direction keeping the most spread once everything is flattened onto the wall. Across it — the width of the head — is the second, the most left over at right angles.
Now the honest part. The shadow has no thickness. No amount of staring tells you how thick the handle is; that dimension went into it. PCA keeps the directions where your data varies and discards the rest, permanently.
And if the hammer sits far off to one side, the shadow's position mostly tells you where it is, not what shape it is. That's why the data gets centred first.
How It Actually Works
One line of intuition, then the algebra
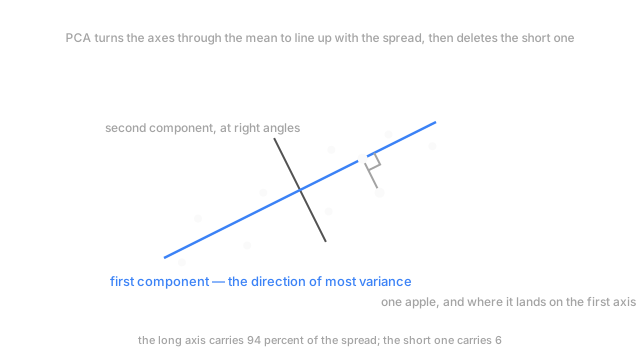
Find the direction along which your apples vary most: component one. Now the direction of most remaining variance at right angles to it: component two. Keep going until you run out of dimensions.
Those directions turn out to be the eigenvectors of the covariance matrix of your centred data, and the variance along each is its eigenvalue. So the explained-variance ratio of component is:
Here is that component's eigenvalue, the variance your apples have along it, and the sum runs over every component. One eigenvalue over the total: the fraction of the spread one axis carries. In the diagram the long axis holds 94 percent, the short one 6.
In practice nobody forms the covariance matrix. You take the singular value decomposition of the centred data matrix directly, because squaring the data to build a covariance matrix squares its condition number — the same reason least squares uses a decomposition instead of the normal equations. Same answer, better arithmetic (the mechanics).
Two things you can't skip
Centre the columns. Subtract each mean. Skip it and component one comes back pointing at your average apple — a 170-gram, 58-millimetre, 13-Brix direction. True, useless, and quietly wrong downstream.
Standardise when the units differ. Variance is unit-dependent. Weight in grams has a variance in the hundreds; Brix under one. Feed both in raw and weight owns component one outright, not because it matters more but because grams are small units.
What PCA is not
A rotation of your coordinate system followed by deleting axes. That's the whole of it. So it's linear — curved structure does not survive — and reversible up to whatever you deleted: keep all twelve components and you can rebuild every apple exactly.
It's also unsupervised. Nothing about what you're predicting enters the computation. Hunting for the apples that will bruise in transit? PCA has never heard of bruising, and the direction that predicts it may be a half-percent wobble in firmness landing in component eleven.
Interpretation is where write-ups go wrong. Each component is a weighted sum of all twelve original columns. Component one is often readable, usually "overall size". Component two is nine columns with a plus and three with a minus, and calling it "ripeness" is storytelling. Report loadings; don't narrate them.
Code
Three columns, two of which say the same thing. Watch what scaling does to the answer.
import numpy as np
def evr(X: np.ndarray) -> np.ndarray: A = X - X.mean(axis=0) # uncentred PCA returns the mean direction # SVD of A beats forming A.T @ A: that squares the condition number s = np.linalg.svd(A, compute_uv=False) var = s ** 2 / (len(A) - 1) # covariance eigenvalues, largest first return var / var.sum()
rng = np.random.default_rng(0)weight = rng.normal(170.0, 22.0, 400) # gramsdiameter = 0.34 * weight + rng.normal(0.0, 2.0, 400) # mm, mostly weight restatedbrix = rng.normal(13.0, 0.9, 400) # sugar, unrelated to sizeX = np.column_stack([weight, diameter, brix])
print("raw units ", np.round(evr(X), 4))print("standardised ", np.round(evr(X / X.std(axis=0)), 4))# -> raw units [0.9921 0.0066 0.0013]# -> standardised [0.6569 0.3321 0.011 ]Raw, one component swallows 99.2 percent and you'd conclude the data is one-dimensional. Standardised it splits properly: 65.7 percent is the size story weight and diameter both tell, 33.2 percent is sugar, and the last 1.1 percent is noise in diameter. Same data. The units were deciding.
Watch Out For
Dropping the low-variance components before a classifier
You run PCA, keep the components covering 95 percent of the variance, train, and accuracy is worse than on the raw columns. Then it climbs as you add components back — including ones carrying half a percent each. The signal was in a direction you threw away.
Variance is not relevance. PCA never saw your target, so ranking directions by spread has no reason to match ranking them by usefulness, and thin discriminative directions are common. Choose the component count by validation score, not a variance threshold; if you want the target involved, use a supervised method. PCA earns its place for decorrelating inputs, compressing, and drawing pictures.
Fitting the PCA before you split
Cross-validated scores look strong, production is worse, and nothing in the model explains the gap. Check where the rotation was computed. If PCA saw the full dataset it used the means, variances and correlations of the rows you later scored on, so those rows helped choose the axes their own features are expressed in.
Fit on the training rows, transform everything else. Inside cross-validation that means PCA sits in the pipeline, refit on each fold's training part. The effect is usually small and always in the flattering direction, which is what makes it hard to notice — see data leakage for the general shape.
The Quick Version
- PCA finds the direction of most variance, then the most remaining variance at right angles, and so on. Those are the eigenvectors of the covariance matrix.
- Explained-variance ratio is one eigenvalue over the sum of all of them.
- Centre the data, always. Standardise whenever the columns aren't in the same units.
- Computed by SVD on the centred matrix, not by building a covariance matrix.
- Linear and unsupervised. Curves don't survive, and a low-variance direction can be the one that predicts.
- Components are mixtures of every original column, so naming them is usually fiction.