Spatial and Geospatial Data
Latitude and longitude are not two ordinary numbers. Treat them as such and your distances are wrong, and your random split hands the model its neighbours.
Why Does This Exist?
A house-price model gets 4% error in validation and 19% on a new city.
The features were fine. latitude and longitude went in as two float columns, the split was random, and roughly every house in the test set had a neighbour a hundred metres away sitting in the training set — with almost the same price, because that's how property works. The model learned a lookup table of streets.
Coordinates cause two separate problems, and both are invisible in a dataframe. The arithmetic on them is wrong, and the rows are not independent.
The one geometric fact everything follows from
A degree of latitude is about 111km anywhere on Earth. A degree of longitude is 111km at the equator and shrinks toward the poles, by the cosine of your latitude. At 55° north that's about 64km.
So the numeric gap 0.1 means 11km if it's latitude and 6.4km if it's longitude, at that latitude. Euclidean distance on raw degrees treats them as the same, and is therefore wrong by a factor that depends on where you are.
Think of It Like This
Two exam candidates sitting next to each other
You're marking an exam and you want to know whether candidates understood the material. So you hold back some answers and check whether the marking scheme predicts them.
Except you picked which answers to hold back at random, from across the hall. Candidate 40 sat beside candidate 41, they copied from each other all afternoon, and one of them is in your held-out set. Your scheme predicts that answer beautifully.
Hold back a whole table instead, and the number gets worse and starts meaning something. Nobody at that table saw a neighbour's paper.
Houses copy from their neighbours. So do weather stations, shops, hospitals and soil samples. Space is a seating plan.
How It Actually Works
Distance, done properly
Haversine gives great-circle distance on a sphere and is the default for any "how far apart" question on raw coordinates. It's accurate to about 0.3% against the real ellipsoid, which is far better than you need for feature engineering.
Projection is the other route, and often the better one. A local projected coordinate system gives you x and y in metres, so ordinary Euclidean arithmetic becomes correct — which matters because clustering, nearest-neighbour indexes and distance-based models all assume a flat metric space. Project first, then cluster.
Representing a location
- Raw coordinates, which a tree can split on and a linear model cannot use sensibly, since price isn't monotone in latitude.
- Distance features: kilometres to the city centre, to the nearest station, to the nearest competitor. These are usually the strongest thing on the page, because they encode what actually drives the outcome.
- Region as a category: postcode district, ward, census tract. High cardinality, so target encoding or an embedding, and it leaks the moment you fit it across the split.
- Grid cells: geohash or H3. A geohash is a string whose prefix is a hierarchy, so truncating it zooms out, which makes multi-resolution features nearly free. H3 uses hexagons, and every hexagon's neighbours sit at roughly equal distance, whereas a square cell's diagonal neighbours are 41% further than its edge neighbours. That's why H3 wins for anything neighbour-based.
- Counts and density in a radius: restaurants within 500m, crimes within a kilometre in the last 30 days. Note the "last 30 days" — the moment a spatial feature has a time window on it, as-of correctness applies too.
Spatial autocorrelation is the leak
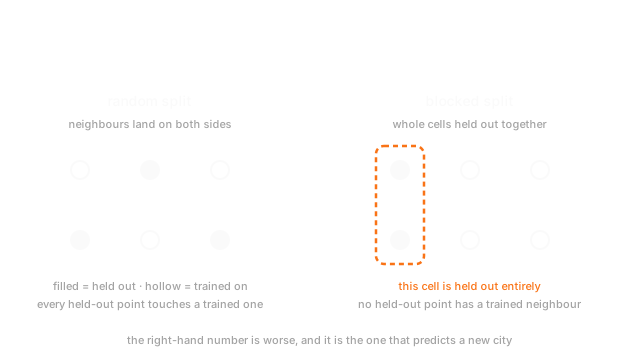
Nearby things resemble each other. That's not a nuisance, it's the reason location predicts anything. It also means a random split violates the independence your validation number assumes, exactly the way a random split on time-ordered rows does.
The fix is a spatially blocked split: hold out whole regions, whole grid cells, or whole cities, so no test location has a training neighbour. Expect the honest score to be much worse. That drop is not a regression, it's the measurement you didn't have before, and it's the number that predicts what happens when you launch in a new city. Data leakage covers the general shape.
Worked example
Two pairs of points at 55° north. One pair differs by 0.1° of latitude, the other by 0.1° of longitude. Numerically, both gaps are 0.1.
Haversine says the first pair is 11.12km apart and the second 6.38km. The ratio is 1.74, and it's just .
So a model using Euclidean distance on degrees believes two points 6.4km apart east-west are as far apart as two points 11.1km apart north-south. Every nearest-neighbour lookup in that space is stretched, and the stretch changes with latitude, so a model fitted in London is wrong differently in Madrid.
Code
import numpy as np
R_KM: float = 6371.0lat: float = 55.0
def haversine(lat1: float, lon1: float, lat2: float, lon2: float) -> float: """Great-circle distance in kilometres, the default for raw coordinates.""" p1, p2 = np.radians([lat1, lat2]) dp, dl = p2 - p1, np.radians(lon2 - lon1) a = np.sin(dp / 2) ** 2 + np.cos(p1) * np.cos(p2) * np.sin(dl / 2) ** 2 return float(2 * R_KM * np.arcsin(np.sqrt(a)))
north: float = haversine(lat, 0.0, lat + 0.1, 0.0) # 0.1 degrees of latitudeeast: float = haversine(lat, 0.0, lat, 0.1) # 0.1 degrees of longitude
print(round(north, 2), round(east, 2)) # -> 11.12 6.38print(round(north / east, 3)) # -> 1.743print(round(float(1 / np.cos(np.radians(lat))), 3)) # -> 1.743 the same numberThe last two lines agreeing is the whole point: the distortion isn't an approximation error, it's the cosine of your latitude.
Watch Out For
A random split on data that has a location
train_test_split(X, y, random_state=42) on anything with coordinates in it.
Nearly every held-out row now has a training row a few hundred metres away, with a similar target, so the model can score well by recognising places instead of understanding them. Validation is excellent. The first new market is a disaster, and the post-mortem calls it drift.
Run the check before you ship: split by region, city, or H3 cell instead, and compare. An 8-point drop means 8 points of your original score were memorised geography.
Two related traps. Cross-validation folds need the same treatment, so use grouped folds keyed on the cell. And a region-level target encoding fitted across the whole dataset leaks the neighbours' prices directly into the feature, which is the same bug wearing a different name.
Coordinates that aren't where you think they are
Two failures, both of which produce valid floats.
Order. GeoJSON is longitude-first. Most APIs, spreadsheets and humans are latitude-first. Swap them and a London address lands off the coast of Somalia — unless both values happen to be small, in which case it lands somewhere plausible and nobody notices. Assert the ranges: latitude within ±90, longitude within ±180, and if your data is one country, assert its bounding box.
Failed geocoding. An address that can't be resolved often comes back as (0, 0), which is a real point in the Gulf of Guinea, sometimes called Null Island. It's the most densely populated place in many datasets. Every distance feature on those rows is nonsense, and because the rows aren't null, no missing-data check finds them.
Count exact (0, 0) pairs, count rows outside your bounding box, and treat both as missing rather than as locations.
The Quick Version
- A degree of latitude is 111km everywhere; a degree of longitude shrinks by the cosine of latitude, so raw-degree Euclidean distance is wrong by a place-dependent factor.
- At 55° north, 0.1° of latitude is 11.12km and 0.1° of longitude is 6.38km. The ratio is exactly .
- Use haversine on raw coordinates, or project to metres first and then use ordinary distance.
- The strongest features are usually distances and counts: kilometres to the nearest station, competitors within 500m.
- H3 hexagons beat square grids for neighbour features, because a square's diagonal neighbour is 41% further than its edge neighbour. A geohash prefix is a hierarchy, so truncation zooms out.
- Spatial autocorrelation means nearby rows aren't independent, so a random split lets the model memorise streets.
- Split by region or cell, and expect a much worse number. That worse number is the one that predicts a new city.
- Assert coordinate ranges and hunt exact
(0, 0): swapped order and failed geocodes both produce valid floats in the wrong place.