Visual explainer
t-SNE & UMAP
Preserve local neighborhood probabilities and let strangers spread, unravelling high-dimensional data clouds into faithful two-dimensional visual maps.
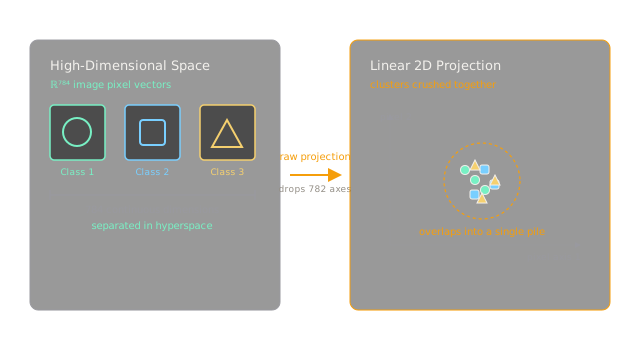
A standard MNIST digit image contains grayscale pixels, defining a coordinate space in . Attempting to visualize this high-dimensional dataset using raw linear projections—such as plotting two arbitrary pixel intensities or standard linear PCA—collapses the underlying non-linear manifold. Because linear projections cast high-dimensional orthogonal variances onto a rigid two-dimensional plane, distinct digits overlap into a dense, uninterpretable cloud of points. Preserving meaningful data structure requires non-linear techniques that respect the local geometry of the manifold.
Locals Stay, Strangers Drift
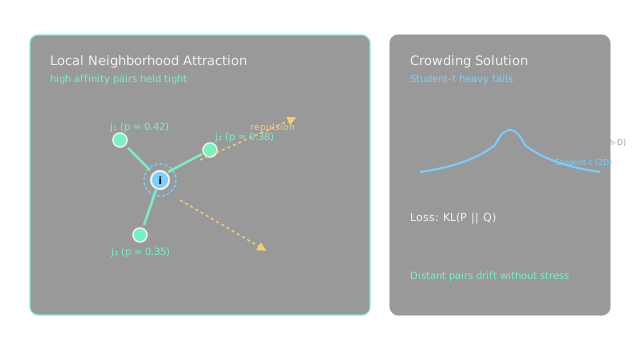
t-Distributed Stochastic Neighbor Embedding (t-SNE) converts Euclidean distances into conditional probabilities that represent affinities. In high-dimensional space, the probability that point picks as its neighbor is modeled with a Gaussian distribution: . In the low-dimensional embedding space, t-SNE models affinities using a heavy-tailed Student- distribution with one degree of freedom (a Cauchy distribution): . Minimizing the Kullback-Leibler divergence exerts strong attractive forces on true neighbors while the heavy tails solve the "crowding problem"—allowing moderate and distant strangers to spread outward without distorting the map.
Size Your Peephole
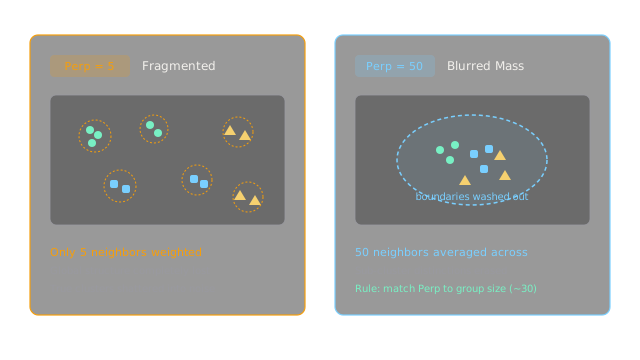
The perplexity parameter dictates the effective number of neighbors each point considers by setting the variance of its local Gaussian distribution: . Choosing the wrong perplexity radically distorts the visual layout:
- Perplexity = 5: The neighborhood radius is too small. The algorithm focuses exclusively on micro-structures, shattering a single cohesive cluster into an array of isolated, artificial micro-islands.
- Perplexity = 50: The neighborhood radius is too large. The algorithm averages over global distances, washing out subtle sub-cluster boundaries and merging distinct sub-populations into an undifferentiated spherical mass.
- A balanced perplexity (typically between 20 and 50) matches the expected natural cluster size, revealing true hierarchical clustering.
Cousins Stay Together
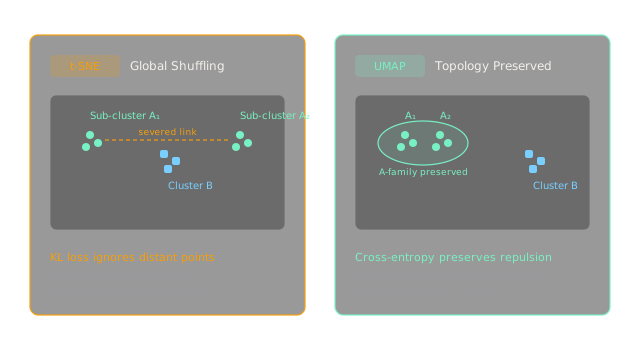
Because t-SNE minimizes , it incurs zero penalty when even if is large. Consequently, t-SNE does not care where distant clusters end up relative to one another; related sub-clusters and can be severed and placed on opposite sides of unrelated cluster . Uniform Manifold Approximation and Projection (UMAP) grounds its optimization in Riemannian geometry and fuzzy simplicial sets. UMAP minimizes fuzzy set cross-entropy: . The second term explicitly penalizes false repulsions, preserving the macro-scale global continuum so related cousin clusters remain adjacent.
Mush Becomes Blobs
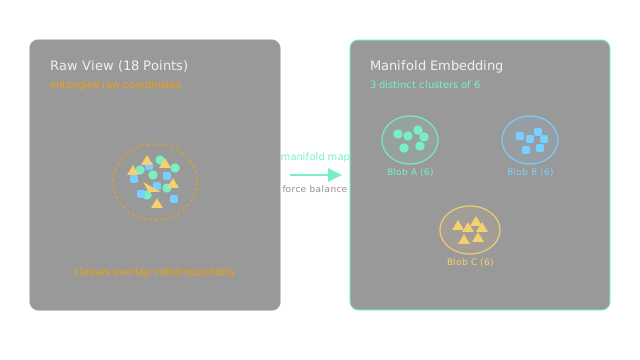
Consider 18 high-dimensional samples representing three latent classes (six circles, six squares, six triangles). Seen straight on through unoptimized coordinates, all 18 dots overlap indistinguishably. Under manifold learning, iterative gradient descent pushes and pulls coordinates: spring-like attractive forces draw points with high mutual affinity together, while global repulsion pushes non-neighbors into the background. At equilibrium, the single chaotic mush parts cleanly into three well-isolated clusters of six, faithfully capturing the latent manifold structure hidden inside the original 784 dimensions.
Big or Careful?
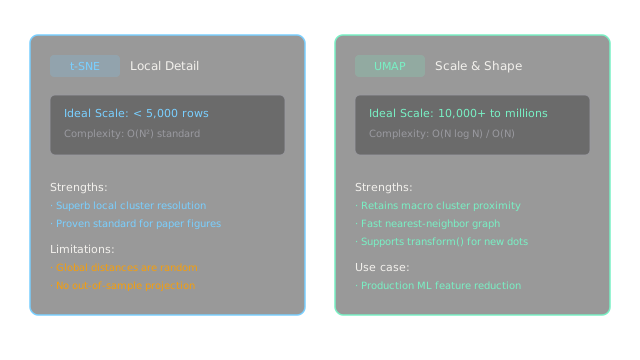
Choosing between t-SNE and UMAP depends on dataset scale and downstream modeling needs:
- t-SNE: Best suited for detailed exploratory visualization of small-to-medium datasets (). Its standard exact implementation scales quadratically (), and it is strictly transductive—it cannot project new, unseen test points into an existing map without recomputing the entire embedding.
- UMAP: Scales efficiently to millions of data points ( or using Approximate Nearest Neighbors via PyNNDescent). UMAP preserves global cluster layout far better and supports an out-of-sample
.transform()method, enabling its use as a non-linear feature engineering step for downstream classifiers.
Where It Breaks
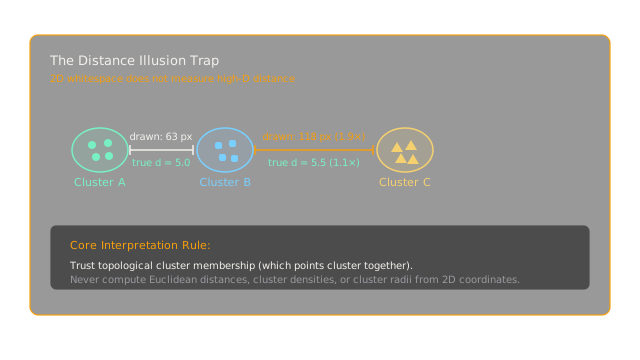
The most dangerous pitfall in interpreting manifold embeddings is treating low-dimensional whitespace as an absolute metric:
- Distorted distances: Two clusters separated by 63 pixels on screen might have a true high-dimensional distance of 5.0, while another pair separated by 118 pixels (a visual gap) has a true distance of 5.5 (only larger). Because local probabilities dominate the objective, inter-cluster spacing in the 2D layout is largely arbitrary.
- Density equalization: Both algorithms expand dense clusters and contract sparse ones to ensure clear visual separation. Never estimate high-dimensional variance or perform distance-based spatial clustering directly on the 2D coordinates.
The Quick Version
- Linear projections crush high-dimensional manifolds into overlapping, unreadable clouds.
- t-SNE pairs high-D Gaussian probabilities with low-D Student- heavy tails to solve the crowding problem.
- Perplexity tunes the effective neighborhood window: too low shatters clusters, too high blurs them.
- UMAP uses cross-entropy loss to preserve global continuum and keep cousin clusters together.
- Eighteen entangled high-dimensional points resolve cleanly into three distinct clusters of six.
- Use t-SNE for small exploratory maps; use UMAP for large datasets and out-of-sample projections.
- Low-dimensional whitespace gaps and cluster radii do not measure true high-dimensional distances.