Error Analysis
The process of manually reading model failures, grouping them into causes, and counting the groups to convert an opaque error rate into a ranked list of fixable problems.
Why Does This Exist?
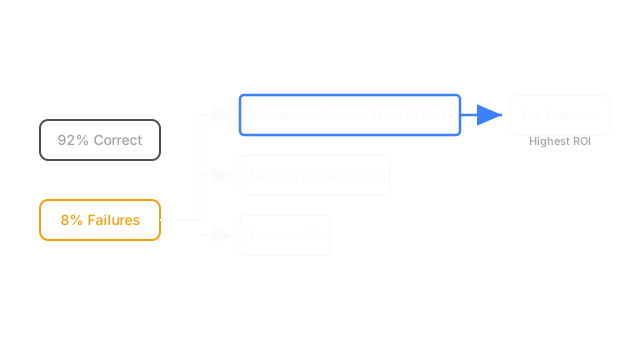
When a model evaluation pipeline finishes running, it outputs a single aggregate number—perhaps your accuracy is 92%. In an academic setting or a Kaggle competition, you might celebrate that number and move on. In a production setting, that number is simply the starting point, because a 92% accuracy means you have an 8% failure rate.
If you do not know why the model is failing 8% of the time, you cannot fix it. You can guess. You can try a larger architecture, you can tune the learning rate, or you can switch optimizers. This is colloquially known as "hopeful hyperparameter tuning," and it is an incredibly expensive way to make no progress.
Error analysis exists to replace guesswork with a deterministic roadmap. It is the practice of manually examining the examples your model got wrong, grouping those failures into a taxonomy of root causes, and then counting the size of each group. By doing this, you convert an opaque failure rate into a ranked work queue. If you discover that 45% of your errors are caused by mislabeled ground truth, you immediately know that tuning the learning rate is a waste of time—you need to fix the dataset. Error analysis is the highest-return skill in applied machine learning, yet it is rarely taught.
Think of It Like This
Think of error analysis like a doctor diagnosing a patient with a fever.
A thermometer tells the doctor that the patient has a high temperature (the aggregate metric: 8% error rate). But a fever is not a disease; it is a symptom of a disease. If the doctor blindly prescribes medicine without knowing the cause, the patient might not get better.
Error analysis is the diagnostic work. The doctor looks at the specific symptoms, runs tests (examining the failures), and concludes that 60% of similar cases are bacterial infections, 30% are viral, and 10% are allergic reactions. Now, the doctor knows exactly which treatment will yield the highest return on investment.
How It Actually Works
Error analysis is an iterative, deeply manual loop. It cannot be fully automated because it requires human judgment to determine why the model failed. The process follows a strict sequence: sample, taxonomise, measure, and act.
1. Sample the Errors
First, you run your model over an evaluation dataset using a rigorous evaluation harness. You filter the results to isolate only the examples where the model's prediction mismatched the ground truth or failed to meet a threshold.
If your dataset is small, you should read every single error. If your dataset is massive, you take a random sample of the errors—typically 50 to 100 examples. This sample size is large enough to reveal the dominant failure modes without taking weeks to review.
2. Taxonomise
This is the hardest and most valuable step. You sit down, open a spreadsheet or an annotation tool, and read the errors one by one. For each error, you ask: Why did the model get this wrong?
Initially, you will not have categories. You invent them as you go. You might notice that the model keeps failing on images taken at night, so you create a "Low Light" category. You might notice that the model predicts "Positive" but the ground truth says "Negative," yet when you read the text, the model is actually correct—the human annotator made a mistake. You create a "Ground Truth Error" category. You continue this until every error in your sample is assigned a root cause.
3. Measure the Categories
Once you have categorized your sample, you count the occurrences in each bucket. You might end up with a distribution that looks like this:
- Mislabeled Ground Truth: 45%
- Missing Context (ambiguous inputs): 30%
- Formatting / Parsing Errors: 15%
- Genuine Capability Failures: 10%
This step transforms subjective observation into objective measurement. It tells you exactly where your model's ceiling is and what is holding it back.
4. Act on the Largest Bucket
You now have a ranked list of problems. You take the largest bucket and fix it. If 45% of your errors are due to mislabeled ground truth, the highest-ROI action is to re-label the evaluation set. You completely ignore the smaller buckets until the largest one is resolved. Once you deploy the fix, you re-evaluate the model, sample the new errors, and start the loop over again.
Code
Error analysis is primarily a human process, but you need code to extract and sample the failures. Here is how you might isolate and sample errors for manual review.
import pandas as pdimport random
def extract_errors_for_review( predictions: pd.DataFrame, sample_size: int = 50) -> pd.DataFrame: """ Extracts a random sample of errors for manual taxonomy. Assumes a DataFrame with columns: ['input', 'ground_truth', 'prediction'] """ # 1. Isolate the failures errors_df = predictions[predictions['prediction'] != predictions['ground_truth']] total_errors = len(errors_df) print(f"Total errors found: {total_errors}") # 2. Sample if the error pool is too large if total_errors > sample_size: review_sample = errors_df.sample(n=sample_size, random_state=42) else: review_sample = errors_df # 3. Add an empty column for the human to fill in the taxonomy review_sample['error_category'] = "" return review_sample
# The output is exported to a CSV, and the practitioner # manually fills in the 'error_category' column.Watch Out For
Refusing to Read the Data
The most common mistake in applied machine learning is refusing to look at the raw data. Engineers often prefer writing code to reading spreadsheets, so they try to automate error analysis using clustering algorithms or by prompting an LLM to categorize the errors. While LLMs can help scale taxonomy, they often hallucinate causes or miss subtle domain-specific nuances. You must manually read at least the first 50 errors yourself to build an accurate mental model of the problem space.
Chasing the 5% Bucket
When you review errors, you will inevitably find a fascinating, mathematically complex edge case. The temptation is to spend three weeks inventing a novel architecture to solve it. If that edge case only accounts for 5% of your total errors, your time is wasted. Always work down the taxonomy strictly by volume. Fix the boring, high-volume problems first.
The Quick Version
- A single aggregate evaluation metric (like 92% accuracy) tells you that you have a problem, but it does not tell you how to fix it.
- Error analysis is the manual process of sampling failures, categorizing their root causes, and counting the categories.
- This process converts an opaque error rate into a ranked, actionable work queue.
- The highest-ROI action in machine learning is almost always fixing the largest bucket in your error taxonomy.
- You must resist the urge to blindly tune hyperparameters or chase rare edge cases until the high-volume data and labeling errors are resolved.