Model Evaluation
Scoring a model is four decisions and not one number: what it never saw, which mistake you count, where you cut the score, and who it quietly fails for.
Why Does This Exist?
A fraud model ships at 99% accuracy. Six weeks later, finance notices that losses never moved. Someone finally checks: 100 of the 10,000 transactions in the test set were fraud, and the model flags nothing at all. Predicting "legitimate" every time scores 99%.
Nobody lied. It just wasn't an answer to any question anyone cared about.
So evaluation isn't a metric. A metric is one of four decisions, and the other three are where models actually go wrong. Get the metric right and the split wrong and you've measured memorisation. Get both right and skip the slices and you ship something that fails exactly the people it matters most for.
A held-out set is data the model has never been fitted on, not once and not indirectly — see train, validation and test splits. Leakage is any path by which that data reached the model anyway, and it's why most too-good-to-be-true scores are exactly that.
Think of It Like This
Two ways to test a driving instructor's student
Hand the student the exact route they practised on and they'll pass. You've measured whether they remember the route, which isn't what the licence is for.
Send them out on a road they've never driven and the score means something — but you still have to decide what you're marking. Mark only whether they crashed and someone who never left second gear passes. Mark only speed-limit compliance and someone who drove perfectly through a school zone fails.
Even a good mark hides the case that matters. A student who's fine everywhere except unprotected right turns is exactly as dangerous as one who's mildly bad everywhere, and the average can't tell them apart.
New road, right mark, then look at the turns separately.
How It Actually Works
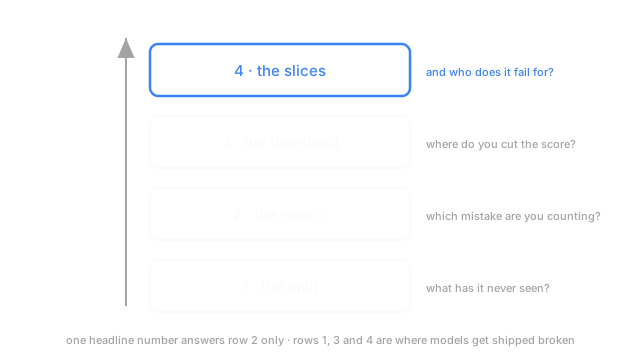
Read the diagram bottom to top: each row is a decision that constrains the one above it.
1 · The split — what has it never seen?
Everything above is worthless if this row is wrong. A single train/test split gives one noisy estimate; cross-validation gives a mean and a spread — and the spread tells you whether a 0.3-point gain is real.
The split has to respect the structure of the problem, not just the row count. Rows from the same patient or document belong in the same fold, or the model memorises the entity instead of the pattern. Time-ordered data splits forward in time only. And every fitted step — scaling, encoding, imputation — goes inside the fold. Fitting a scaler on the full dataset before splitting is the most common leak in production code, and it's silent.
2 · The metric — which mistake are you counting?
A metric encodes which error you can afford. Missing a fraud costs the transaction; flagging a legitimate one costs a customer's afternoon. Those costs aren't equal, so this is a product decision wearing a statistics costume.
Regression metrics trade squared against absolute error. Classification metrics all descend from the confusion matrix, the four-cell table every classification number comes from.
One habit that costs nothing: report a dumb baseline beside your model. Majority class. Training mean. Yesterday's value. If the model can't beat that by more than the fold-to-fold spread, you don't have a result yet.
3 · The threshold — where do you cut the score?
Most classifiers output a number between 0 and 1, and 0.5 is a default rather than a decision. Move it to 0.2 and you catch more fraud and annoy more customers. Move it to 0.8 and the reverse. Same model, different product.
ROC and AUC and the precision–recall curve describe the model across every cut; threshold selection is where you commit to one. If the score also has to mean a probability, that's calibration — a good AUC does not imply it.
4 · The slices — and who does it fail for?
The top row is the one most reports skip, and where the aggregate lies hardest. Break the metric down by what your data is made of: region, device, language, transaction size. A model at 0.91 overall is routinely 0.94 on the bulk of traffic and 0.58 on a segment that's 4% of rows and 30% of revenue.
Averages hide minorities by construction. If a slice matters, it needs its own number.
Code
The opening story, in arithmetic. No model, no library, just the counting.
import numpy as np
y = np.zeros(10_000, dtype=int)y[:100] = 1 # 100 frauds hiding in 10,000 transactionsnever_flags = np.zeros_like(y) # the model that answers "legitimate", always
def report(y: np.ndarray, pred: np.ndarray) -> str: tp = int((pred & y).sum()) fp = int((pred & (1 - y)).sum()) fn = int(((1 - pred) & y).sum()) right = tp + int(((1 - pred) & (1 - y)).sum()) recall = tp / (tp + fn) if tp + fn else float("nan") precision = tp / (tp + fp) if tp + fp else float("nan") return f"accuracy {right / y.size:.4f} recall {recall:.2f} precision {precision:.2f}"
print(report(y, never_flags))# -> accuracy 0.9900 recall 0.00 precision nanAccuracy 0.99. Recall 0.00. Precision undefined, because the model never made a positive prediction to be right or wrong about. Three numbers off the same predictions, one of them flattering.
Watch Out For
Tuning on the test set, one decision at a time
Nobody trains on the test set on purpose. It happens slowly: check test performance, adjust a hyperparameter, check again, try a feature, check again. Forty peeks later the test set is a training set, and your number is optimistic by a margin nobody can estimate.
The fix is boring and it works. Tune on validation folds. Touch the test set once, at the end, when nothing is left to change. If model selection happens in the same data that produces the final estimate, that estimate is biased upward by construction and needs a nested loop.
Optimising a metric nobody downstream uses
A team spends a quarter pushing AUC from 0.88 to 0.91. The system shows a reviewer the top ten results, and they look at three. AUC measures ranking across the entire score range; the product uses only the top of it. The two can move in opposite directions.
So write down what the output causes — which action, at which threshold, for how many items — and pick the metric that measures that. Precision at 10. Recall at a fixed alert budget. An offline metric that doesn't move with the thing you care about costs real quarters and buys nothing.
The Quick Version
- Evaluation is four decisions — split, metric, threshold, slices. A single number answers only the second.
- Accuracy on imbalanced data is nearly always misleading. 99% can mean "predicts one class and stops".
- The split respects entities and time, and every fitted transform lives inside the fold. Otherwise you're measuring leakage.
- Report a dumb baseline and a spread beside every score. A win smaller than the spread isn't a win.
- Threshold is a product decision, separate from model quality. 0.5 is a default, not a choice.
- Slice every headline metric. Averages hide minority segments by design, and that's where the failure usually lives.
- Test-set contamination arrives through a hundred small peeks, not one big mistake.