Confusion Matrix
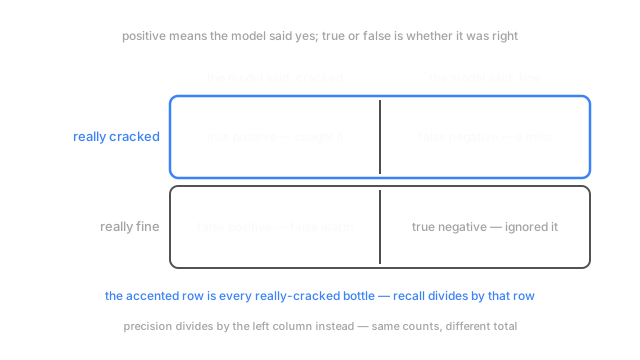
Four counts, one grid. Positive means the model said yes, true or false means whether it was right, and every other classification number divides these cells.
Why Does This Exist?
A camera watches bottles go past on a filling line and calls each one cracked or fine. One shift is 12,000 bottles, 240 genuinely cracked. The camera flags 552.
Those numbers don't line up, and the interesting question is how. Only four things can happen to a bottle: the camera says cracked and it was, says cracked when it wasn't, says fine when it wasn't, says fine and it was. Count each and you have the whole picture — every percentage in every model report is those four numbers over a different total.
The names are where people trip. Positive never means good — it means the model said yes. True or false says whether the model was right. Stack those and the cells name themselves: a false positive is a false alarm, a good bottle in the reject bin, and a false negative is a miss, a cracked bottle heading out on a pallet.
A false alarm costs one bottle, about thirty cents. A miss costs a customer finding glass in their drink, plus the batch recall. Nothing inside the model knows that ratio. The grid also assumes somebody inspected those 12,000 bottles by hand — that's ground truth, and the table is only as honest as it is.
Think of It Like This
The smoke alarm in your kitchen
Your kitchen alarm has two ways to be wrong. Burnt toast sets it off and you stand on a chair waving a towel — a false alarm. It sleeps through an actual pan fire — a miss.
In a kitchen you tolerate the jumpy version, because towel-waving is irritating and a house fire is not. So it ships deliberately over-sensitive.
Put the same alarm in an aircraft cabin and the arithmetic flips. A false alarm there means an emergency descent and three hundred people in the wrong city, so it's tuned much harder to trip, accepting a slower response to real smoke. Same device, same two failure modes, opposite settings — the cost of each mistake changed, not the physics.
How It Actually Works
The four counts, on one shift
Of the 240 cracked bottles the camera caught 168 and missed 72. Of the 11,760 good ones it passed 11,376 and binned 384. That's the grid.
Read it along the rows and it answers one question: of the bottles that really were cracked, what did the camera do? Down the columns it answers another: of the bottles the camera flagged, what were they really? Rows are fixed by reality — 240 cracked bottles exist whether the camera runs or not. Columns are fixed by the camera. That asymmetry is behind nearly every argument about classification metrics.
The same cells over different totals
Divide the 168 catches by the row they sit in and you get 0.70: seven in ten cracked bottles caught. That's recall — its denominator is the accented row in the diagram.
Divide those same 168 by their column, all 552 flags, and you get 0.30: three in ten rejections were justified. That's precision.
Divide the two correct cells by the whole table, 11,544 of 12,000, and you get 0.962. Accuracy, and it's why nobody caught this sooner. One numerator, three denominators, three numbers that disagree, and not one of them is lying. Choosing between them is what classification metrics is for.
More than two classes
Nothing about the grid needs exactly two classes. Sort bottles into fine, cracked, underfilled or askew label and you get a table, where is the number of classes. Rows stay the truth, columns stay the call, the diagonal holds what the model got right.
The off-diagonal cells are where the value is, because mistakes cluster. Underfilled bottles get read as fine hundreds of times while askew labels barely confuse it. One of those says the fill sensor needs better lighting; the other says leave it alone. No aggregate score hands you that. And all of it is drawn at one threshold.
Code
One line of counting, and it works for any number of classes.
import numpy as np
rng = np.random.default_rng(11)truth = rng.choice(4, 12_000, p=[0.90, 0.02, 0.05, 0.03]) # fine, cracked, underfilled, askewslips = rng.random(12_000) < np.array([0.02, 0.25, 0.45, 0.10])[truth]pred = np.where(slips, np.array([3, 0, 0, 0])[truth], truth) # a slip lands on the lookalike
def confusion(truth: np.ndarray, pred: np.ndarray, k: int) -> np.ndarray: # each (truth, pred) pair indexes one cell of the flattened grid, so no loop is needed return np.bincount(truth * k + pred, minlength=k * k).reshape(k, k)
print(confusion(truth, pred, 4)) # rows are the truth, columns are what the model called# -> [[10608 0 0 217]# -> [ 59 175 0 0]# -> [ 250 0 339 0]# -> [ 26 0 0 326]]Row three: 250 underfilled bottles called fine, against 339 caught. The camera misses two in five, and nothing in this run's headline numbers drops below 0.93.
Watch Out For
Reading the grid with the axes silently swapped
Somebody points at the top-right cell and says "so we have 384 misses". If the rows are the model's predictions rather than the truth, that cell is 384 false alarms, and every conclusion from it is backwards — including which number was precision and which was recall.
There is no universal convention. Common Python tooling puts truth on the rows, plenty of papers put it on the columns, and some plotting helpers transpose to fit their labels. The fix is cheap: label the axes in words on the figure, and check anyone else's against the one thing you can verify independently. Row totals have to equal the class counts in the data. If they don't, the table is transposed.
Treating the matrix as a property of the model
A team reports "the model has 384 false positives" as though it were fixed, like a parameter count. Then someone nudges the decision cut from 0.5 to 0.7 to quiet the reject bin and the number is 96. Nothing about the model changed.
A confusion matrix is a snapshot of a model at one threshold, on one dataset, and all four cells move in a locked pattern: tighten the cut and false alarms fall while misses rise, always. So a matrix without its threshold beside it can't be reproduced, and two models are only comparable if both were cut in the same place. When the cut is the open question, ROC and AUC and the precision–recall curve show every threshold at once.
The Quick Version
- Four counts in a grid: what the model said, crossed with whether it was right.
- Positive means the model said yes, not that the news is good. False positive is a false alarm, false negative is a miss.
- Which one costs more is a business fact. The grid counts; it doesn't judge.
- Every classification number is these cells over a different total: recall by a row, precision by a column, accuracy by everything. That's why they disagree.
- With more classes, the off-diagonal cells name which classes get mistaken for which — more actionable than any single score.
- The grid holds at one threshold only. Move the cut and all four cells move together.
- Check which axis is the truth before reading anyone's matrix, your own tooling included.