Overfitting and Underfitting
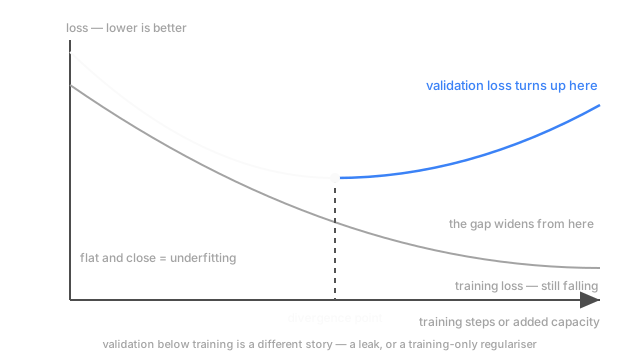
Underfitting is both curves high and flat. Overfitting is training loss still falling while validation loss turns up. You read it off curves, not off vibes.
Why Does This Exist?
You're predicting the failure load of a welded joint from one ultrasound feature, and you have sixty welds. Sixty, because the only way to know a joint's failure load is to pull it apart, and every label costs you the thing you measured.
Both ways of getting this wrong look identical from outside — the model is bad — and they respond to opposite treatments. Add capacity to a model that's underfitting and it improves. Add capacity to one that's overfitting and it gets worse. Guess wrong and you'll spend a week making the thing less useful, with every intermediate result seeming to encourage you.
Bias and variance give the theory. This page is the reading, off actual curves. Split the sixty welds: thirty you fit on, thirty you hold back and never touch. Training loss is the error on the first thirty, validation loss the error on the second. Most bad decisions come from looking at one.
Think of It Like This
Tracing a coastline for a chart you'll use tomorrow
You're surveying a rocky bay to make a navigation chart. Draw one straight line from the north headland to the south one and you've made a chart no amount of extra surveying can fix — the reef sits mid-bay, and a straight line has no room to bend around it. Walk the shore another week and the line still misses the reef. It was never a data problem.
Now go the other way. Trace everything: every pebble, every puddle, the wet edge of the sand at three in the afternoon. Tomorrow the tide is different, the sand has shifted, and the boat runs aground anyway.
The chart people navigate with sits between. Headlands, reef, channel — whatever will still be there tomorrow. Overfitting is mistaking this afternoon's tideline for the rock underneath, and the frustrating part is that the traced chart matched the shore better than the useful one did.
How It Actually Works
Both diagnoses come out of one pair of curves on shared axes, plotted against however you're adding capability: gradient steps for a fitted network, polynomial degree for a closed-form fit. Same picture, different dial.
Underfitting: high, flat, close together
Training loss stops falling while it's still bad, validation loss sits right beside it, and both flatten. The closeness is the informative part — the model isn't even managing to memorise thirty welds, so nothing about the held-out thirty is the issue.
Add capacity. Higher degree, deeper network, less weight decay. Add features, or better ones: a second ultrasound channel, the joint's geometry.
Don't collect more welds. This is the one that catches people. A straight line fitted to sixty welds and one fitted to six thousand are the same straight line, and the reef stays unmapped. Don't add regularisation either; that's pushing the wrong way with more force.
Overfitting: the divergence
Training loss keeps falling. Validation loss falls with it, flattens, and turns back up. That turn is the whole signal, and everything past it is the model fitting noise specific to your thirty training welds.
Pull capacity out or constrain it. Stop at the turn. Ridge regression and weight decay shrink the coefficients so the fit can't swing as hard. Dropout stops a network leaning on any single unit. Cap a tree's depth — an unpruned decision tree drives training loss to zero and learns nothing transferable doing it. Here more data genuinely helps, and it's the one fix that costs no expressiveness.
Don't add capacity, add features, or train past the turn. All three widen the gap.
The third shape, which people misread
Validation loss below training loss. It looks like a gift and almost never is. Three causes, in the order to check them. A leak: a scaler fitted on all sixty before splitting, or one physical joint in both halves under two IDs. A regulariser active only while training — dropout and augmentation both make training loss look worse than it is, so the two numbers aren't measuring the same thing. Or plain sampling noise. Check the size: two percent on thirty welds is noise, fifteen percent is a leak.
Code
Sweep the capacity dial and all three shapes appear at once.
import numpy as np
def split_losses(degree: int) -> tuple[float, float]: rng = np.random.default_rng(3) x = np.sort(rng.uniform(-3.0, 3.0, 60)) y = np.tanh(x) + rng.normal(0.0, 0.25, 60) tr, va = np.arange(0, 60, 2), np.arange(1, 60, 2) # interleaved, so both span the range w = np.polyfit(x[tr], y[tr], degree) rmse = [float(np.sqrt(np.mean((np.polyval(w, x[s]) - y[s]) ** 2))) for s in (tr, va)] return rmse[0], rmse[1]
for d in (1, 3, 5, 9, 15): train, val = split_losses(d) print(f"degree {d:2d} train {train:.3f} val {val:.3f} gap {val - train:+.3f}") # -> degree 1 train 0.350 val 0.317 gap -0.033 # -> degree 3 train 0.224 val 0.350 gap +0.126 # -> degree 15 train 0.172 val 2.597 gap +2.425Degree 1 is the straight line across the bay: both losses high, validation slightly under training. That's the third shape, harmless cause — thirty held-out points, a flip of 0.033. Degree 3 has already turned. By degree 15, training loss is the best on the board and validation is off by a factor of fifteen. The best training number belongs to the worst model.
Watch Out For
Early-stopping on a set you also tuned on
You pick the stopping step where validation loss bottoms out. Then you try four learning rates and keep whichever bottomed lowest. Then a fifth. Every one of those choices used the validation set, so what you're reporting is a best-of-many, and best-of-many is biased upward by construction. The symptom shows up later, as a test score well below the validation score you'd been quoting.
Keep a third split you touch once, at the end, or use nested cross-validation if sixty welds won't stretch to three parts. Past a few dozen decisions guided by the same held-out set, it has quietly become training data.
Calling it overfitting when the two splits aren't comparable
The gap widens, you reach for regularisation, and it doesn't help. Then more data doesn't help either. Neither works because the model isn't overfitting: your validation set came from somewhere else. Welds from the third bay, or from after the electrode supplier changed, or a time-ordered split where validation is simply later.
Refit on a shuffled split to tell them apart. If the gap collapses it was distribution shift rather than capacity, and the fix is to make the splits comparable or accept the shifted number as the better estimate of production.
The Quick Version
- Underfitting: both losses high, flat, close. Add capacity or features. More data changes nothing.
- Overfitting: training loss falling while validation turns up. Cut capacity, regularise, stop at the turn, or get more data.
- The turn in the validation curve is the diagnosis. One number from one split isn't.
- Validation below training means a leak, a training-only regulariser, or noise. Check the size of the flip first.
- The lowest training loss on your list is regularly the worst model on it.
- A widening gap can also be distribution shift. Shuffle the split to tell which.