Random Forests
Bagged trees stall when one column dominates every split. Hide most of the columns at each split and the trees stop agreeing, which is when averaging pays.
Why Does This Exist?
Averaging only helps when the things you average disagree, and one dominant column is what usually stops them.
Here's the case we'll carry down the page. You run a chain of gyms and want to know who renews next month. Nine thousand members, thirty columns each: plan tier, joining month, distance from home, classes booked, and the one that predicts anything — visits in the last thirty days.
Bagging gets you part of the way. Resample the rows, fit a deep tree on each, average the votes. Then the arithmetic bites: averaging correlated models leaves variance , where is one tree's variance and their correlation. More trees shrink the second term; the first is a floor.
Your gym data pushes that floor through the roof. The visits column sits in every resample, wins the root split in every tree by a wide margin, and the level below usually agrees too. Two hundred trees rooted on visits at nearly the same threshold aren't two hundred opinions. They're one opinion with rounding noise.
Breiman's answer in 2001 was to take the choice away from them.
Think of It Like This
Five searchers, two instruments each
A walker is missing on a hillside and five volunteers go out. Give all five the same kit — thermal camera, dog, direction finder, binoculars, whistle — and all five work the same way. The camera picks up the same sun-warmed boulder for everybody, so five people walk to the same wrong rock.
Now hand each volunteer two instruments, drawn at random. One gets the dog and the whistle, another binoculars and the camera. Every searcher is worse than a minute ago, and knows it, because the instrument they wanted is in someone else's bag.
The hillside gets covered better anyway. A dog's false leads and a camera's don't land on the same boulder, so five reports carry five different kinds of wrong. Worse searchers, better search.
How It Actually Works
A second dice roll, at every split
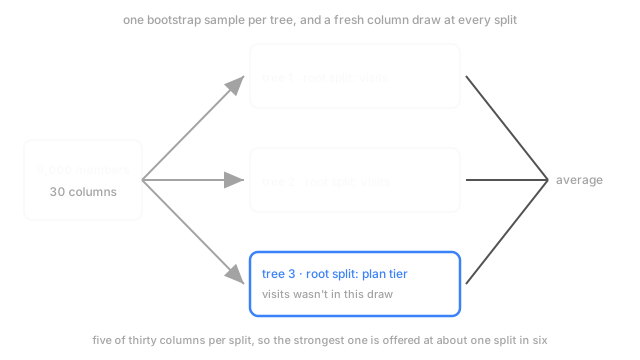
A forest keeps bagging's bootstrap of the rows and adds one rule inside the tree. At every split, draw of the columns at random and consider only those. Defaults are for classification and for regression, so thirty columns means five candidates — not five for the tree, five for that split, redrawn at the next one.
Visits is therefore on offer at about one split in six. The rest of the time the tree builds something out of commute distance and class bookings, which it can, because the rows carry signal without their best column.
Handicapping, deliberately. Each tree comes out weaker than bagging's, so rises — but falls faster, and is the term compute can't touch. That trade is the whole design.
Grow them deep, and stop counting them
Trees in a forest are grown deep and unpruned on purpose. A lone tree that deep memorises individuals, which is what pruning prevents. Inside a forest, averaging is the variance treatment, so pruning would only add bias the ensemble was never going to suffer.
More trees never overfit either. Adding them drives the second variance term toward zero and then stops, so the curve flattens rather than turning back up. Tree count is a budget, not a hyperparameter: go to 500, watch it flatten, stop paying. The knobs that change the model are and the minimum rows per leaf.
Validation for free
Each resample leaves about 36.8% of rows behind, and those rows are out-of-bag for the tree fitted on it — never seen, so predictions there are genuinely held out. Every member has roughly a third of the forest for which they were out of bag, so averaging those predictions per member gives you validation with nothing reserved and nothing extra fitted.
Two limits. At 50 trees a row is scored by around 18, a weaker ensemble than the one you'll ship, so the estimate reads pessimistic. And it assumes independent rows — the pitfall below.
Against gradient boosting: a tuned boosted model usually wins a tabular benchmark, and a forest is much harder to get wrong. No learning rate, no early stopping, two knobs. Start here, then see whether the extra points are worth the tuning.
Code
One split, scored twice: all thirty columns on offer, then five. Count the distinct root winners across forty trees.
import numpy as np
rng = np.random.default_rng(0)x = rng.normal(size=(600, 30))renews = (1.8 * x[:, 0] + 0.6 * x[:, 1] + rng.normal(0.0, 0.5, 600) > 0).astype(int)
def root_split(rows: np.ndarray, cols: np.ndarray) -> int: y, gains = renews[rows], [] for f in cols: # only the drawn columns are even looked at lo = x[rows, f] <= np.median(x[rows, f]) # one candidate cut per column, at its median gains.append(y.var() - lo.mean() * y[lo].var() - (1 - lo.mean()) * y[~lo].var()) return int(cols[int(np.argmax(gains))])
def distinct_roots(m: int, trees: int = 40) -> int: picks = [root_split(rng.integers(0, 600, 600), rng.choice(30, m, replace=False)) for _ in range(trees)] return len(set(picks))
print(f"all 30 columns offered: {distinct_roots(30)} distinct root split | 5 of 30 offered: {distinct_roots(5)}")# -> all 30 columns offered: 1 distinct root split | 5 of 30 offered: 18Column 0 is the visits stand-in. Offered every time, it wins the root forty times out of forty. Restrict each split to five columns and the same forty trees root on eighteen different ones — the correlation drop, visible before a tree has finished growing.
Watch Out For
Shipping impurity-based feature importance as a finding
The importances your library prints sum how much each column reduced impurity across the forest. They get read as a ranking of what drives the outcome, and someone makes a decision on that.
They're inflated for high-cardinality columns: nine thousand distinct values gets thousands of chances to look useful, a binary flag gets one. And when two columns carry the same information, split credit lands on whichever one was drawn, so a predictive pair can read as one strong column and one weak one. Permutation importance on held-out data asks the question you meant. Feature selection covers where each version is safe.
Trusting out-of-bag error when rows come in groups
Your gym chain runs corporate plans, so one employer signs up sixty members at once. Same address, same plan tier, same joining month, similar commute. Out-of-bag error says 0.91 and next month says 0.78.
The mechanism is quiet. A row being out of bag means only that that row was missed, and each of its fifty-nine near-twins had a 63% chance of landing in the same bag, so nearly every out-of-bag row is scored by trees that already fitted a duplicate of it. Optimistic, in exactly the way a grouped split would have caught. Group the resampling by employer, or hold out whole employers instead.
The Quick Version
- Bagging plus a second dice roll: at every split only a random of the columns are considered — for classification, for regression, redrawn per split.
- The target is , the correlation between trees, because is the floor bagging can't get under.
- Grow trees deep and unpruned. Averaging handles the variance, so pruning would only add bias.
- More trees stop paying rather than overfitting, so count is compute. Columns per split and leaf size are the knobs.
- Out-of-bag rows give you validation with nothing held out: pessimistic with few trees, optimistic with grouped rows.
- Impurity importance is not a finding. Permute or drop columns on held-out data.