Probability Calibration
A model can rank perfectly and still lie about the odds. Calibration asks a narrower thing: of everything you scored 0.70, did about 70% actually happen?
Why Does This Exist?
Your parts team ordered 3,781 van batteries, because that's what the model's scores added up to across the 8,000-van fleet. Then 2,447 failed. The model was never wrong about which vans were in trouble — the ones it ranked highest really did break down — but the arithmetic downstream came out 55% high.
Ranking: sort the fleet by score, and do the failures cluster at the top? That's what AUC and most usual metrics measure. Calibration is stricter — of every van you scored 0.70, about 70 in 100 should fail inside the month. Seventy, not most of them.
Only the first had ever been checked. And ranking is enough right up until the number enters a calculation rather than a sort — a budget, an expected cost, a cut derived from two costs.
Think of It Like This
A fuel gauge that's right about which tank is fuller
Two vans in the yard, one gauge you don't trust. Read both: the one showing more diesel genuinely has more diesel. Every time. As a ranking instrument it's flawless.
Now plan a route with it. It reads a quarter tank, you call that 60 miles of range, and the van coasts to a stop at 32. It never lied about which tank was fuller. It lied about how much was in either, and the moment you multiplied the reading, that became the only fact that mattered.
Fixing it is physical. Pour in a measured 10 litres, note the needle, repeat at 20 and 30, then plot needle reading against litres poured. A straight line means the gauge is honest. Points sagging under it mean it reads high — and you now hold a lookup table that undoes the lie.
That plot is a reliability diagram.
How It Actually Works
The reliability diagram
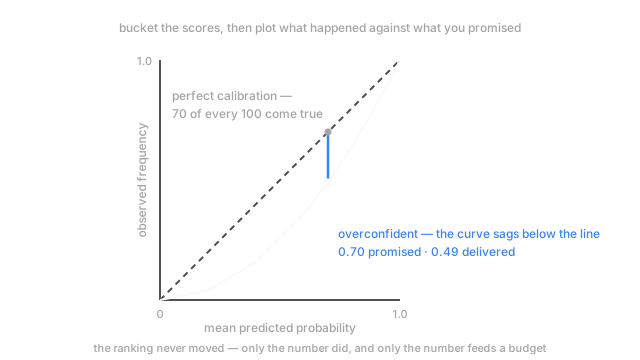
You can't check one prediction. A van either fails or it doesn't, so 0.70 on a single van is unfalsifiable. Calibration is a property of groups, which is why the check needs buckets.
Take scored vans the model hasn't seen. Sort by score, cut into ten equal-count bins — equal-width bins put four vans in the top one and the diagram dissolves into noise — and per bin plot the mean score against the fraction that actually failed. Perfect calibration lands those points on the diagonal. Sagging below it means the model reads high, exactly like the gauge; above means underconfident.
Which models lie, and in which direction
Logistic regression fitted by maximum likelihood comes out close to calibrated, structurally: the log loss it minimises rewards honest frequencies, and the fitted intercept pins mean predicted probability to the base rate. Regularise hard and it decays — shrinkage drags scores toward the middle.
Gradient boosting is dependably overconfident. Each round pushes training margins further out, so scores pile against 0 and 1 and the curve takes a stretched-S shape.
Naive Bayes is the worst offender, instructively. It multiplies per-feature likelihoods as though features were independent, so battery age and total charge cycles — the same evidence twice — push the product off to 0.998. Its ranking is often fine. Its numbers aren't frequencies.
An SVM hands you a signed distance from a hyperplane. Squash it through a sigmoid and you get a number between 0 and 1, which isn't the same as a probability.
Platt scaling and isotonic regression
Both fixes are one move: fit a one-input model mapping raw scores to probabilities, on data the original model has never seen.
Platt scaling is a logistic regression with a single feature, the score, and two parameters. A few hundred held-out rows will do. The cost is the assumption baked in — it only undoes distortion shaped like a sigmoid, which happens to describe margin-based and boosted models well.
Isotonic regression fits the best non-decreasing step function, assuming nothing beyond monotone. It straightens curves Platt can't reach, and it overfits with enthusiasm — 300 rows and it carves steps describing those 300 rows. Under about a thousand held-out examples, use Platt.
Then score the result with the Brier score, the mean squared gap between your probability and the 0-or-1 outcome. It's a proper scoring rule: it bottoms out only when you report what you believe, and no threshold trick improves it. It blends ranking with calibration, so it's the verdict and the diagram is the diagnosis.
Code
One monotone distortion, and the failure appears.
import numpy as np
def brier(p: np.ndarray, t: np.ndarray) -> float: return float(((p - t) ** 2).mean())
rng = np.random.default_rng(0)risk = rng.uniform(0.02, 0.60, 8000) # each van's real 30-day failure risky = (rng.random(8000) < risk).astype(float)score = risk ** 0.6 # ranks perfectly, reads high everywherefit, held = np.arange(0, 8000, 2), np.arange(1, 8000, 2)bucket = np.clip((score * 10).astype(int), 0, 7) # eight equal-width bucketsobserved = np.array([y[fit][bucket[fit] == b].mean() for b in range(8)])
for b in (2, 5, 7): # one row of the reliability diagram each m = bucket[held] == b print(f"scored {score[held][m].mean():.2f} actual {y[held][m].mean():.2f}")print(f"Brier raw {brier(score[held], y[held]):.4f}", f"remapped {brier(observed[bucket[held]], y[held]):.4f}")# -> scored 0.25 actual 0.10# -> scored 0.55 actual 0.39# -> scored 0.72 actual 0.59# -> Brier raw 0.2122 remapped 0.1836Raising the risk to the power 0.6 is strictly increasing, so ordering is untouched and AUC is identical to the bit — yet every bucket reads high by 12 to 15 points. Remapping each score to its bucket's observed rate, which is histogram binning, takes Brier from 0.2122 to 0.1836 against a floor of 0.1828.
Watch Out For
Fitting the calibrator on the model's own training predictions
It's convenient and it looks like it works: the reliability curve snaps onto the diagonal, Brier improves. Then production comes back miscalibrated in the same direction, by roughly the same amount.
A model's predictions on its own training rows are optimistic in a way its predictions on new rows aren't, so the calibrator learns the one distortion production doesn't have. Fit it on a dedicated split, or on out-of-fold predictions — see train, validation and test splits — then measure on a third set neither has touched.
Rebalancing the classes and then reading the outputs as probabilities
Failures are rare, so someone downsamples the healthy vans or passes class weights. Recall improves, AUC barely moves, everyone signs off.
The intercept is now fitted to a population that doesn't exist. Trained at an even split when reality runs near 1-in-25, every score reads high — precisely the 55% over-order the parts team ate. Nothing catches it: ranking metrics are blind to a monotone shift and no test fails. If you must reweight, and with severe imbalanced data you sometimes must, correct the intercept back to the true base rate afterwards — SMOTE rows included.
The Quick Version
- Ranking and calibration are separate properties and AUC is blind to the second: among everything scored 0.70, about 70% should turn out positive.
- The reliability diagram is the diagnostic: bucket, plot, read the distance from the diagonal.
- Unregularised logistic regression starts near calibrated. Boosted trees run overconfident, naive Bayes wildly so from double-counting correlated evidence, and an SVM margin was never a probability.
- Platt scaling is two parameters and assumes a sigmoid; isotonic fits any monotone step function and overfits under about a thousand rows. Both need held-out data, and Brier — a proper scoring rule — tells you the fix landed.
- Resampling for class imbalance breaks calibration silently and leaves ranking metrics looking fine.